Lucky Block Price Prediction: LBLOCK/USD Sets to Trade above $0.000100 Level
Estimated Reading Time: 3 minutes
Don’t invest unless you’re prepared to lose all the money you invest. This is a high-risk investment and you are unlikely to be protected if something goes wrong. Take 2 minutes to learn more
Lucky Block Price Prediction – September 19
The Lucky Block price prediction shows that LBLOCK is poised to maintain its current sideways trajectory, remaining close to the moving averages.
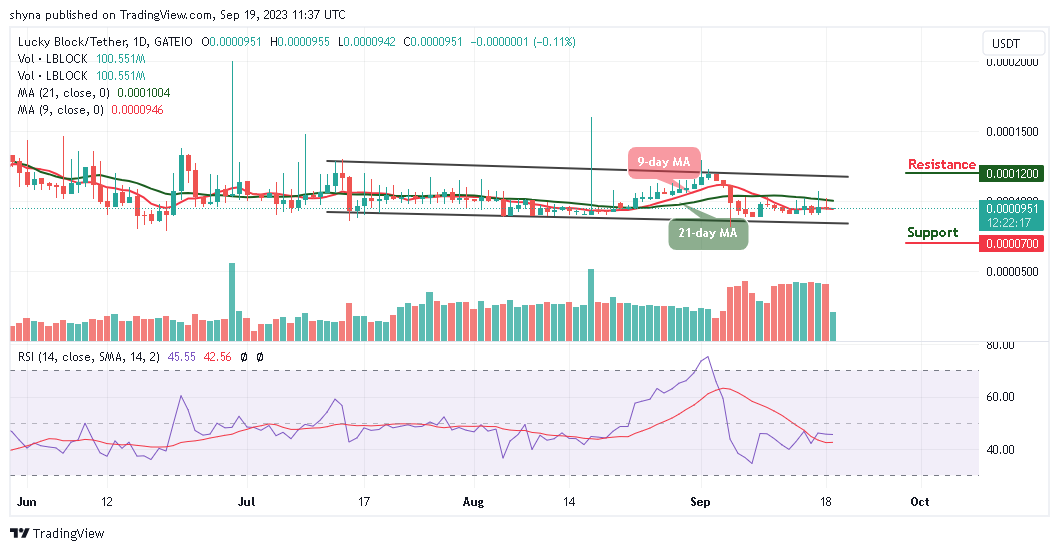
LBLOCK/USD Long-term Trend: Ranging (1D Chart)
Key Levels:
Resistance levels: $0.000120, $0.000130, $0.000140
Support levels: $0.000070, $0.000060, $0.000050
LBLOCK/USD is currently trading in a range defined by the 9-day and 21-day moving averages. However, this consolidation phase is seen as a precursor to a potential upward surge in the Lucky Block price, leading traders to anticipate a forthcoming rally.
Lucky Block Price Prediction: LBLOCK/USD Could Turn Bullish
As per the daily chart analysis, the next move for Lucky Block’s price is to breach the $0.000100 resistance level. Once achieved, bulls are expected to push above the 21-day moving average, targeting resistance levels at $0.0000120, $0.000130, and $0.000140. Concurrently, the Relative Strength Index (RSI) at 14 periods is poised to cross above the 50-level. However, in the event of a temporary retracement, support levels at $0.000070, $0.000060, and $0.000050 might come into play, offering potential opportunities for new investors to enter the market.
LBLOCK/USD Medium-term Trend: Ranging (4H Chart)
In the 4-hour chart, Lucky Block is currently trading within the 9-day and 21-day moving averages, with the potential to break above the upper boundary of the channel. The Relative Strength Index (RSI) at 14 periods is moving sideways around the 50-level but it could begin to show signs of moving upwards.
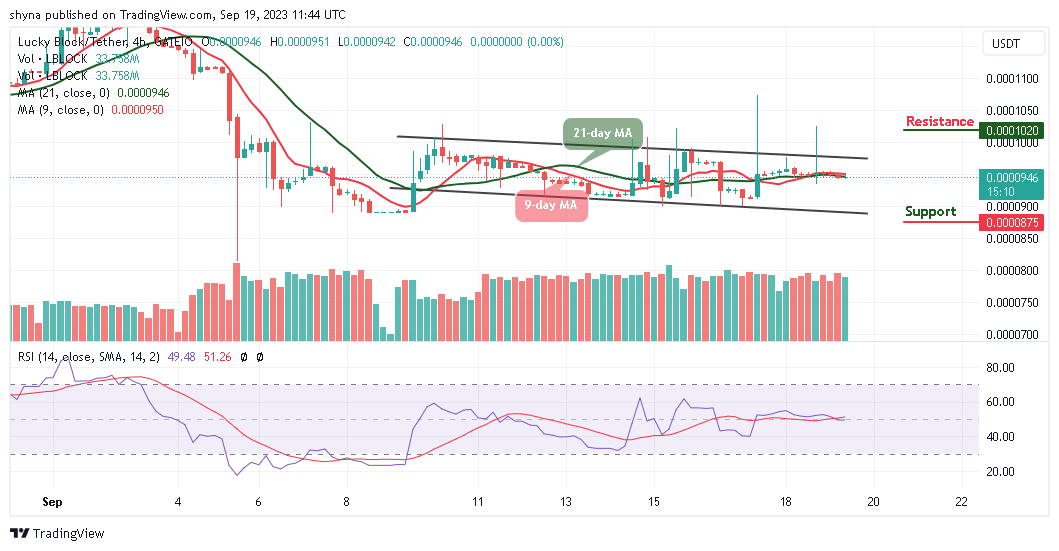
Nonetheless, should the bulls succeed in pushing the price above the channel, Lucky Block could ascend to the $0.000102 resistance level and above. However, this scenario may not materialize if the 9-day moving average crosses below the 21-day moving average, which could drive the price toward the lower boundary of the channel. Staying within this range could lead the coin to test the $0.000087 support level and below, presenting an opportunity for new buyers to enter the market.
You can purchase Lucky Block here. Buy LBLOCK