Lucky Block Price Prediction: LBLOCK/USD Surges By 4.07% to Keep Bullish Movement Intact
Estimated Reading Time: 2 minutes
Don’t invest unless you’re prepared to lose all the money you invest. This is a high-risk investment and you are unlikely to be protected if something goes wrong. Take 2 minutes to learn more

Free Crypto Signals Channel
The Lucky Block price prediction is riding the bulls on the daily chart as many buyers will have a great week ahead.
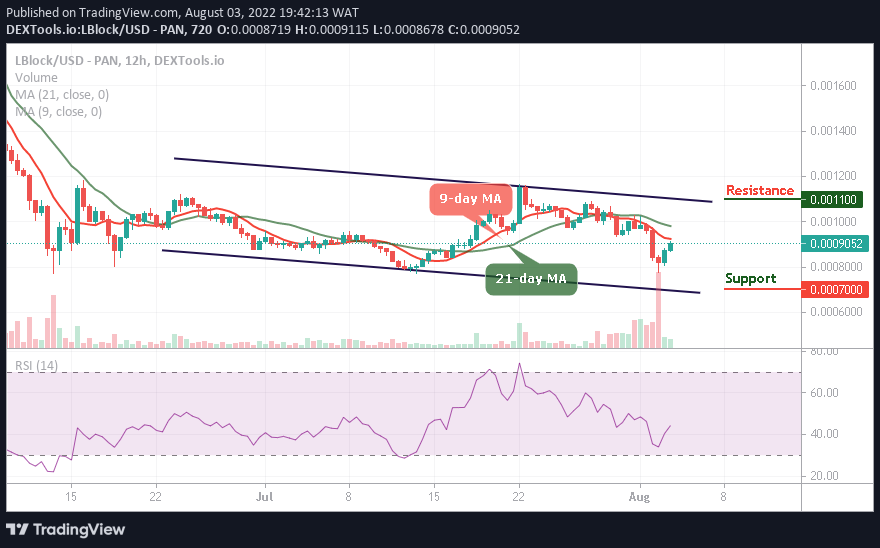
LBLOCK/USD Medium-term Trend: Ranging (12H Chart)
Key Levels:
Resistance levels: $0.0011, $0.0012, $0.0013
Support levels: $0.0007, $0.0006, $0.0005
LBLOCK/USD continues to increase significantly, bulls are taking charge. At the time of writing, the Lucky Block price is currently facing a potential resistance at the $0.0010 level above the 9-day and 21-day moving averages. However, a break above this barrier will produce a huge green candle above the channel, marking resistances at $0.0011, $0012, and $0012.
Lucky Block Price Prediction: LBLOCK/USD Shoots to the Upside
The Lucky Block price is hovering at $0.0009 where it heads to the north. However, as the coin moves to the upside, it will locate the potential resistance levels at $0.0011, $0.0012, and $0.0013. In contrast, the technical indicator Relative Strength Index (14) moves above the 40-level to confirm the bullish movement. On the contrary, any bearish movement towards the lower boundary of the channel may hit the supports at $0.0007, $0.0006, and $0.0005.
LBLOCK/USD Medium-term Trend: Bearish (4H Chart)
Looking at the 4-hour chart, LBLOCK/USD spikes above the 9-day moving average as the technical indicator Relative Strength Index (14) moves above the 40-level. Moreover, any further bullish movement above the current market value will hit the resistance level at $0.0011 and above.
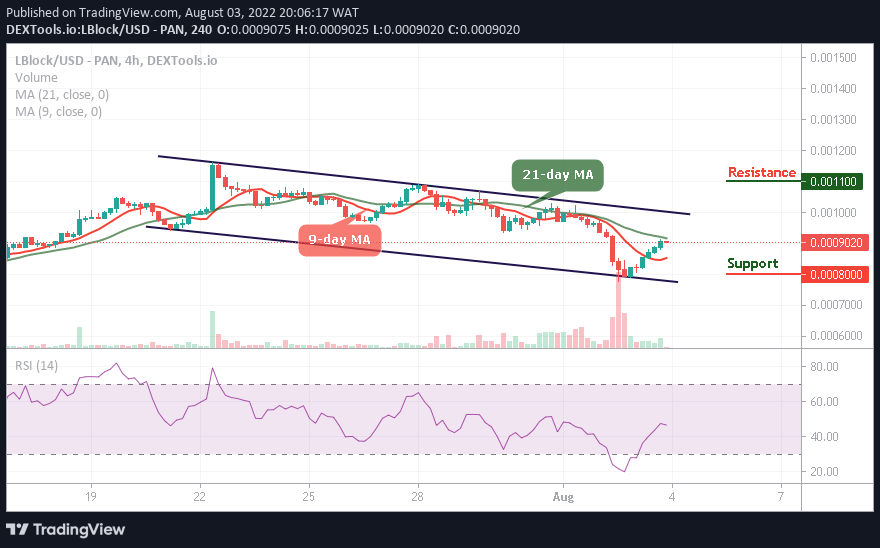
On the contrary, LBLOCK/USD may retreat below the 9-day moving average and could head towards the south if the bears step into the market. The Lucky Block price could touch the critical support at $0.0008 and below as the new buyers are expected to come into the market while the existing buyers are expected to buy the dip.
You can purchase Lucky Block here. Buy LBLOCK