SPONGE/USD ($SPONGE) Market Outlook: Signs Point to a Rebound as Accumulation Grows at Key Support
Estimated Reading Time: 3 minutes
Don’t invest unless you’re prepared to lose all the money you invest. This is a high-risk investment and you are unlikely to be protected if something goes wrong. Take 2 minutes to learn more

After a prolonged bearish drift, SPONGE (SPONGE/USD) has dipped below the psychological $0.0001 mark, raising concerns among traders. However, the market appears to be carving out a potential floor around the $0.00009 region—a price level that’s gaining attention as a possible inflection point for recovery.
Critical Technical Zones to Watch
-
Immediate Resistance: $0.000115, $0.000120, $0.000130
-
Key Support: $0.000090, $0.000085, $0.000080
$SPONGE Daily Chart Perspective: A Setup for Mean Reversion?
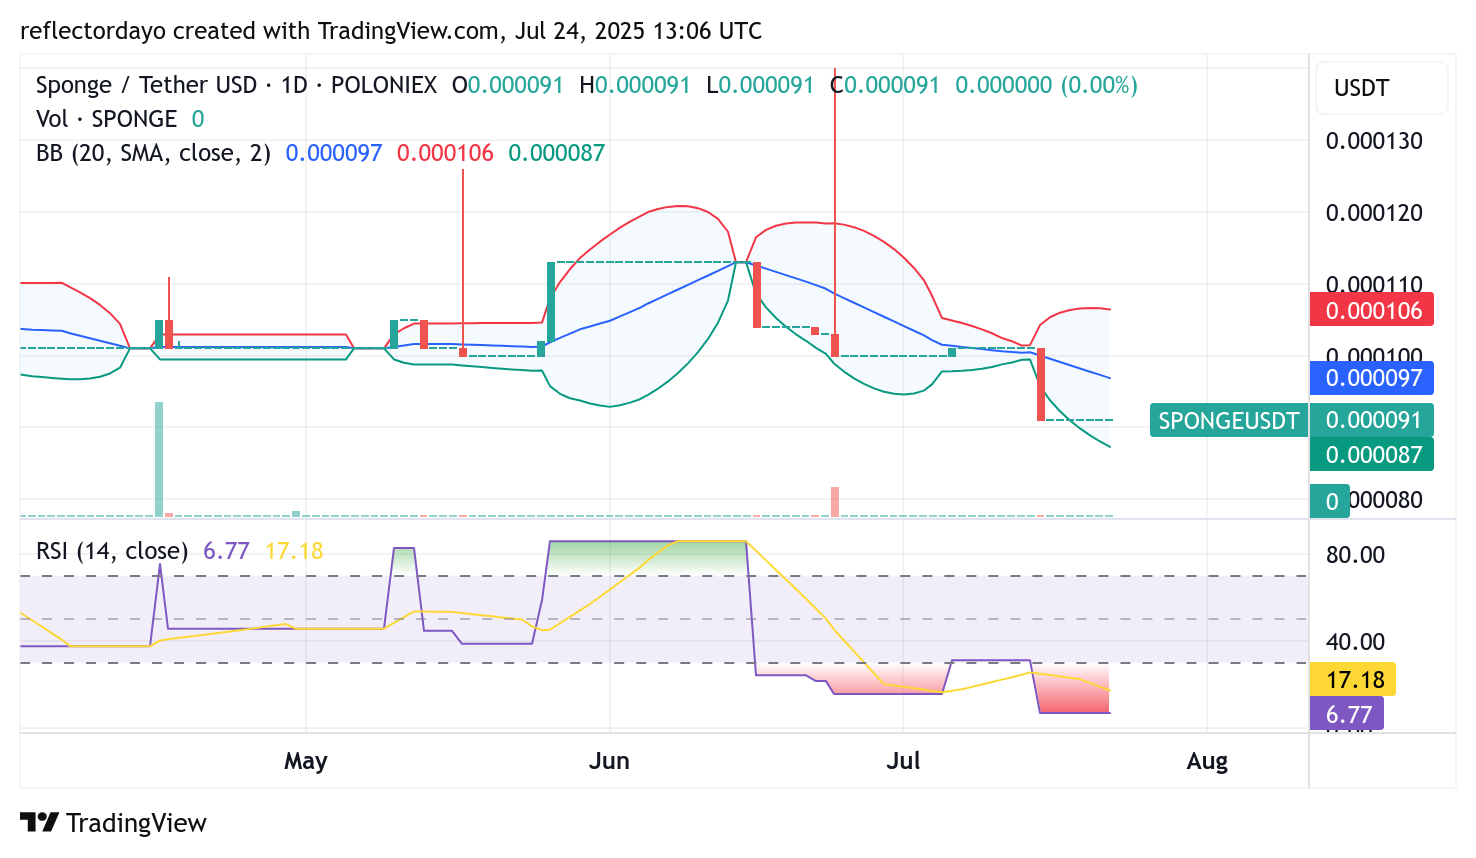
On the daily timeframe, SPONGE/USD is flashing an oversold signal according to the Relative Strength Index (RSI), which now hovers at a level typically associated with rebound phases. Historically, similar RSI readings have aligned with bounce scenarios, especially when they occur near well-tested support zones. The current price structure suggests a potential “value zone” that may appeal to contrarian traders looking to capitalize on discount entries.
SPONGE/USD 4-Hour Chart Breakdown: Demand Zone Holding Strong
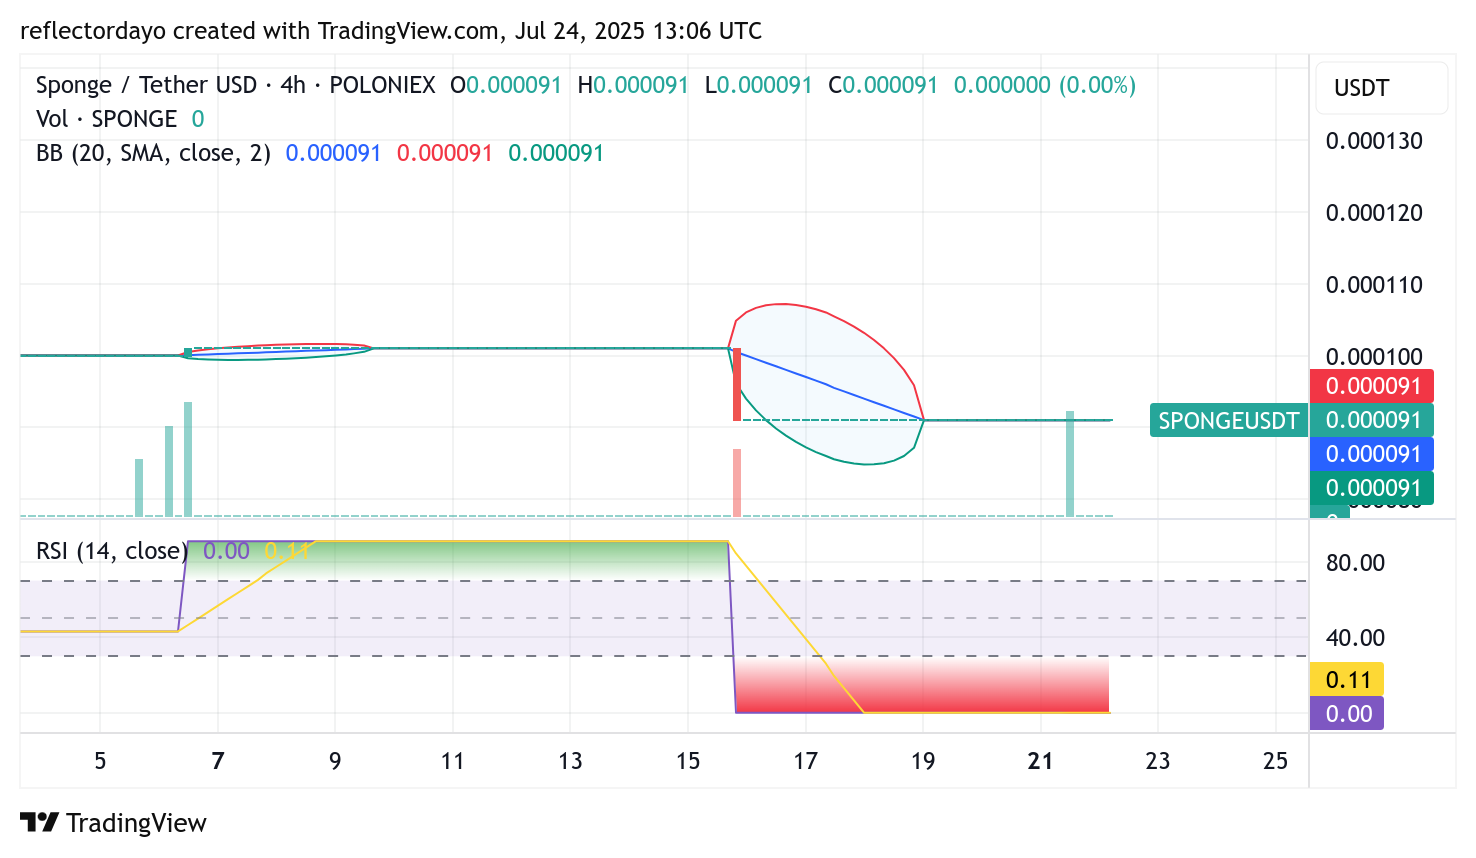
Shorter timeframes, such as the 4-hour chart, offer more granular insight into what may be forming as a classic accumulation range. The $0.00009 mark has become a defensive line, with price action repeatedly finding footing and resisting further descent. This suggests that selling momentum is fading while quiet buying activity increases—hallmarks of a buildup phase before a trend reversal.
The lack of new lows and the narrowing range signal possible preparation for a bullish breakout, particularly if upcoming candles begin to challenge overhead resistance levels with increased volume.
While the broader trend remains cautious, the technical picture paints a scenario in which the bottom may be near—or already in. With oversold conditions aligning with historical demand zones, SPONGE/USD could be setting the stage for a recovery. Active traders may consider watching for confirmation via breakout volume or bullish crossover signals before entering the market.
Buy $SPONGE
Can feel the bears itchin pic.twitter.com/HJSDQS9V4s
— $SPONGE (@spongeoneth) July 22, 2025
Join the SPONGE community and get in on the next big crypto opportunity! Buy Sponge ($SPONGE) today