Chainlink Remains Above $9.00 but Faces an Additional Drop
Estimated Reading Time: 2 minutes
Don’t invest unless you’re prepared to lose all the money you invest. This is a high-risk investment and you are unlikely to be protected if something goes wrong. Take 2 minutes to learn more

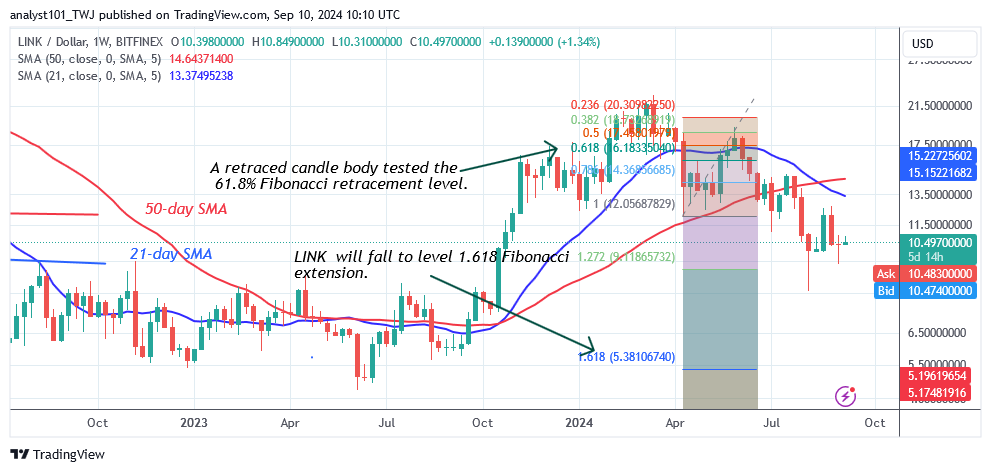
Chainlink (LINK) Long-Term Analysis: Bearish
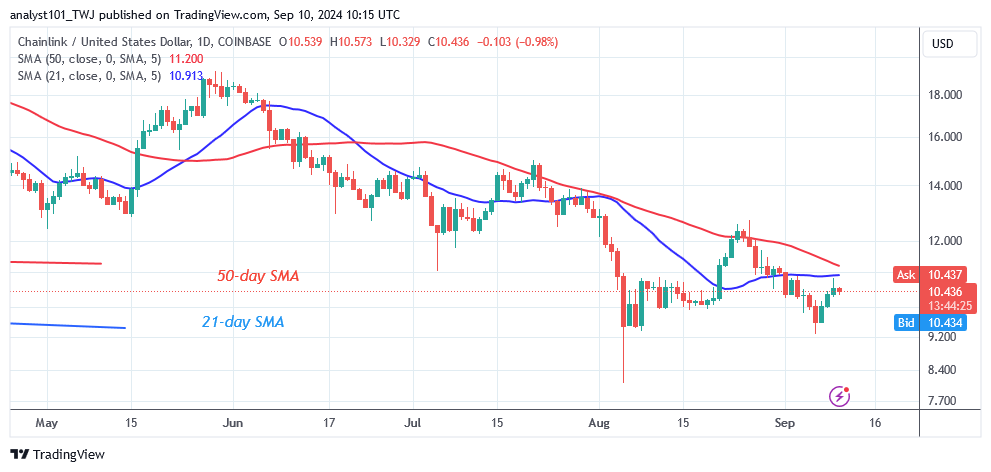
Chainlink’s (LINK) price has remained range-bound but faces an additional drop. On August 5, bulls bought the dips, halting the slide above the $9.00 support. For the past month, buyers have kept the altcoin’s price above the $9.00 support but below the moving average lines or the resistance at $12. The moving average lines, as well as the resistance near $12, have slowed the upward movement.
According to the price indication, the altcoin will drop to its previous low of $8.00. However, if the bears break the $8.00 support level, the negative trend will continue to the low of $5.38.
Technical indicators:
Major Resistance Levels – $20.00, $22.00, $24.00
Major Support Levels – $12.00, $10.00, $8.00
Chainlink (LINK) Indicator Analysis
Since the August 5 price drop, the moving average lines have been sloping horizontally. However, the price bars slope below and above the moving average lines, implying a sideways trend. Doji candlesticks have formed, causing the altcoin to trade modestly.
What Is the Next Direction for Chainlink (LINK)?
Chainlink is predicted to drop in line with price expectations but faces an additional drop. Meanwhile, the altcoin has been trading in the $9.00 to $12 price range. When the range-bound levels are breached, the LINK price will trend. The crypto signal is range-bound, with the altcoin facing another rejection at the moving average lines.
You can purchase Lucky Block here. Buy LBLOCK
Note: Cryptosignals.org is not a financial advisor. Do your research before investing your funds in any financial asset or presented product or event. We are not responsible for your investing result.