Wall Street Memes (WSM/USD) Trade Muscles Up, Ticking Hikes
Estimated Reading Time: 3 minutes
Don’t invest unless you’re prepared to lose all the money you invest. This is a high-risk investment and you are unlikely to be protected if something goes wrong. Take 2 minutes to learn more

Wall Street Memes Price Prediction – May 22
A set of pricing indicators now suggests a balanced market phase for Wall Street Memes coin against the U.S. dollar, with both buyers and sellers exhibiting caution, given that the base instrument muscles up, ticking hikes in its indexes.
Despite ongoing market indecision, price action remains tightly consolidated near critical support levels—specifically at the lower Bollinger Band boundary and the psychologically sensitive zones around $0.0005 and $0.001. This prolonged compression signals a potential volatility build-up. Sellers should be cautious, as continued pressure at these thresholds increases the risk of a sharp bullish reversal. The technical context favors accumulation, aligning with a broader rebound outlook that could catch short-side positions off guard.
WSM/USD Market
Key Levels
Resistance levels: $0.0015, $0.002, $0.0025
Support levels: $0.0005, $0.0004, $0.0003
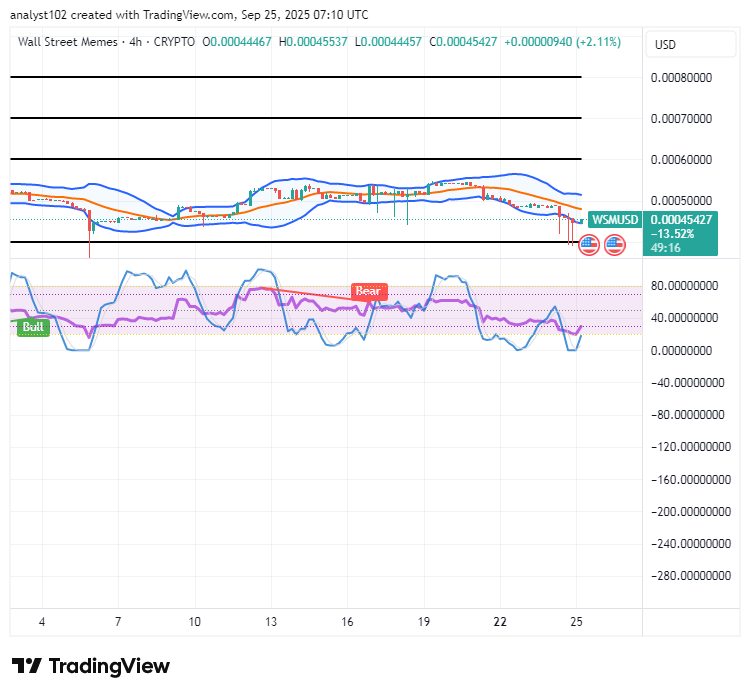
WSM/USD – 4-hour Chart
The WSM/USD 4-hour chart demonstrates that the crypto-economic market muscles up, ticking hikes in its indexes.
The stochastic oscillators are steadily trending north into overbought territory, reflecting sustained bullish momentum with only minor consolidations likely. Meanwhile, the Bollinger Bands are gradually aligning to suggest the formation of a bullish flag pattern, reinforcing the potential for continued upward movement within the $0.0005 to $0.001 range.
Is WSM/USD building bullish momentum above $0.0005, signaling strength while cautioning against selling near the $0.001 support?
Over a couple of sessions, it is indicated that most movements in the WSM/USD market operations have been to let there be a continuity in the wake of building bullish momentum above $0.0005, as the financial outlook of the market reports that the price muscles up, ticking hikes.
While price action stabilizes just below the $0.001 level, suggesting a solid base for potential upside, investors should temper expectations of immediate large gains. Although technical indicators support accumulation and hint at a bullish trajectory, the $0.0005–$0.001 range remains a formative zone. Near-term volatility may persist, and while the broader outlook leans positive, disciplined position management is key to navigating the early stages of this potential uptrend.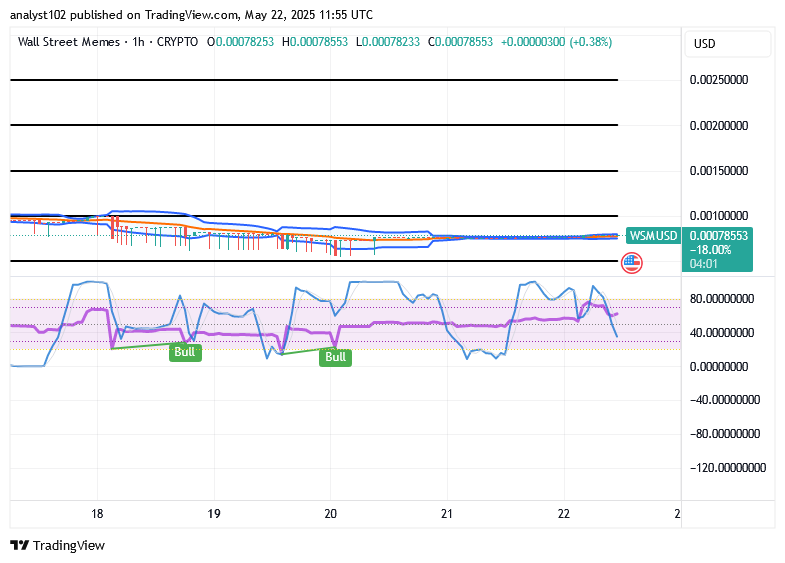
WSM/USD 1-hour chart
The stochastic oscillators have steadily remained swerving about by keeping variant bullish signal notes. The Bollinger Bands have yet to remain east-stretching in the zones of $0.001 and $0.0005. Being as it is, indicators are having that buying velocities are on the set of prevailing with growing momentum and technical alignment.
BIGTIMEUSDT & WSMUSDT Contracts now officially live on Bybit!
🚀 BIGTIMEUSDT & WSMUSDT Contracts now on Bybit!
— Bybit (@Bybit_Official) October 12, 2023
Dive into new trading opportunities with 1-25x leverage. Plus, they’re now on Bybit Futures Grid Bot! Start trading now.
📈 BIGTIME: https://t.co/FAQlbhnzAh
📈 WSM: https://t.co/pb2y2AfMBE#CryptoTrading #Bybit