Lucky Block Price Prediction: LBLOCK/USD Swings Higher after Touching the Low of $0.0006
Estimated Reading Time: 2 minutes
Don’t invest unless you’re prepared to lose all the money you invest. This is a high-risk investment and you are unlikely to be protected if something goes wrong. Take 2 minutes to learn more

Free Crypto Signals Channel
The Lucky Block price prediction is to clear the resistance of $0.0010 as the recovery would be extended above the 9-day moving average to keep more buyers in the market.
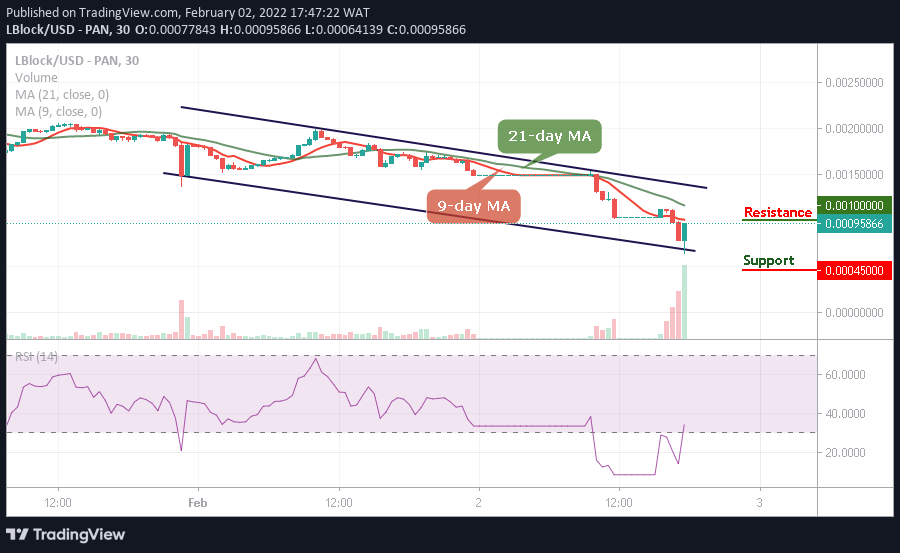
LBLOCK/USD Long-term Trend: Ranging (30 Minutes Chart)
Key Levels:
Resistance levels: $0.0010, $0.0011, $0.0012
Support levels: $0.0004, $0.0003, $0.0002
Looking at the daily chart, LBLOCK/USD indicates an uptrend in the market as the coin moves toward the 9-day and 21-day moving averages. The bulls get ready to push the Lucky Block price higher to encourage more buyers into the market.
Lucky Block Price Prediction: More Bullish Signals Are Coming into Play
Presently, the Lucky Block price moves close to the 9-day moving average in favor of buyers. Therefore, this would be an avenue for the new buyers to come into the market. On the contrary, the coin is likely to hit supports as $0.0004, $0.0003, and $0.0002 but buyers are to buy long immediately this comes to play.
On the upside, considering a continuous upward trend for the Lucky Block, it is going to move close to the upper boundary of the channel in other to hit the resistance levels of $0.0010, $0.0011, and $0.0012 on a long-term bullish as the technical indicator Relative Strength Index (14) gets ready for the spike.
LBLOCK/USD Medium-term Trend: Ranging (15 Minutes Chart)
On the 15-minute chart, the Lucky Block price is hovering above the 9-day and 21-day moving averages at $0.0011 resistance level with a tremendous gain. Therefore, if the coin crosses above the channel, it may push the market to the resistance level of $0.0015 and above.

In other words, if the market drops slightly, the support level of $0.0008 and below may surface, and this could be a good signal for the new buyers to buy long while the technical indicator Relative Strength index (14) moves to cross above 60-level.
Read more: