Lucky Block Price Prediction: LBLOCK/USD Will Attempt an Upside Retracement
Estimated Reading Time: 3 minutes
Don’t invest unless you’re prepared to lose all the money you invest. This is a high-risk investment and you are unlikely to be protected if something goes wrong. Take 2 minutes to learn more
Lucky Block Price Prediction – December 26
The Lucky Block price will recover to the upside as the coin stays above the 9-day and 21-day moving averages.
LBLOCK/USD Medium-term Trend: Bearish (4H Chart)
Key Levels:
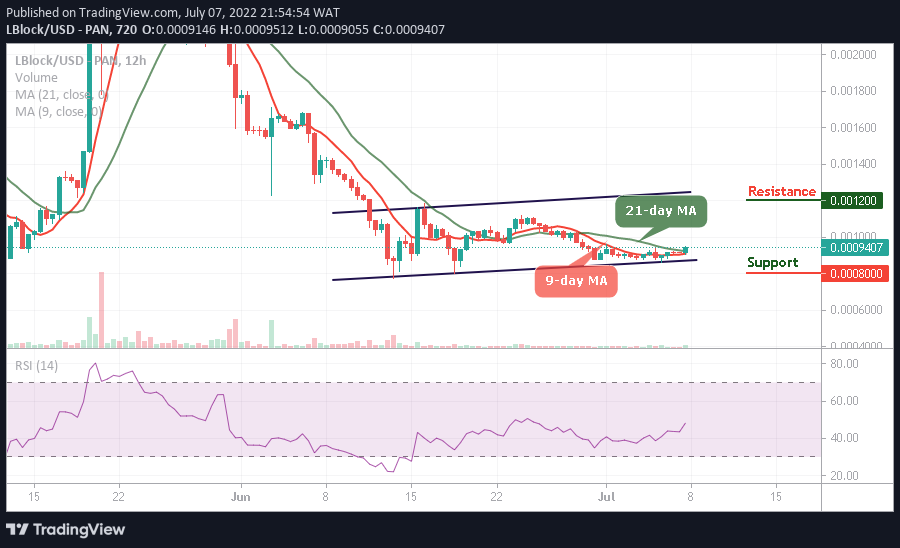
Resistance levels: $0.000210, $0.000220, $0.000230
Support levels: $0.000130, $0.000120, $0.000110
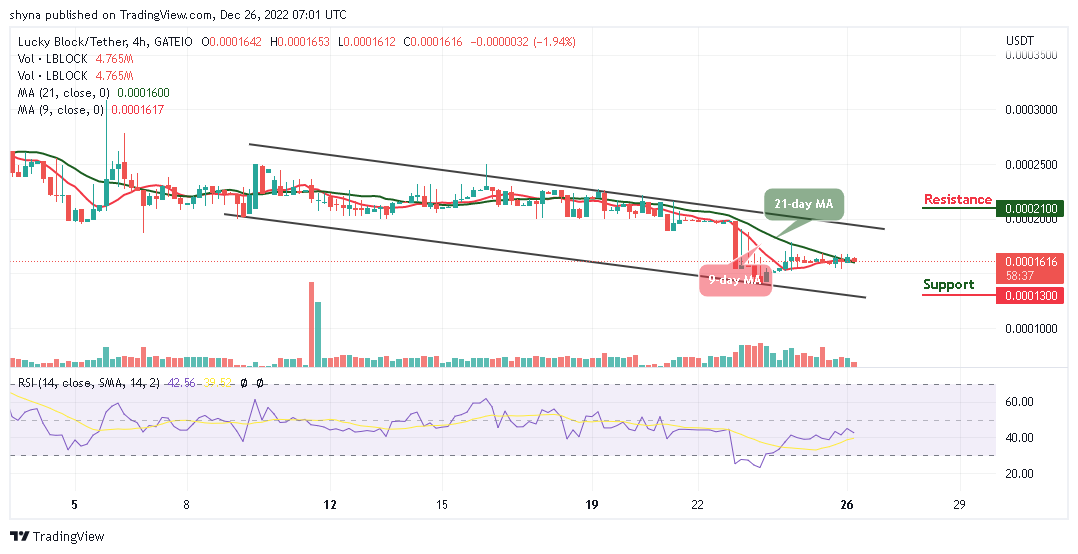
LBLOCK/USD is ranging as the market price stays above the 9-day and the 21-day moving averages, aiming to retrace the lost resistance. Meanwhile, the market is likely to slightly a little if it crosses below the moving averages so that new buyers could enter the market. However, if the bulls fail to keep the price above the moving averages, the Lucky block price may create an additional low.
Lucky Block Price Prediction: LBLOCK/USD Will Spike Higher
The Lucky Block price will begin to break higher as the coin prepares for a bullish movement that could hit the nearest resistance level of $0.000200. However, any further bullish movement will locate the potential resistance levels at $0.000210, $0.000220, and $0.000230.
Meanwhile, the upward movement could be delayed if the sellers bring the market price below the lower boundary of the channel and it could touch the support levels at $0.000130, $0.000120, and $0.000110. Meanwhile, the technical indicator Relative Strength Index (14) remains below the 50-level preparing the coin for upward movement.
LBLOCK/USD Medium-term Trend: Bearish (2H Chart)
When compares to the 2-hour chart, the Lucky Block price keeps hovering within the 9-day and 21-day moving averages, as buyers move to push the coin above the upper boundary of the channel. However, once this comes to focus, a higher resistance level could be located at $0.000200 and above.
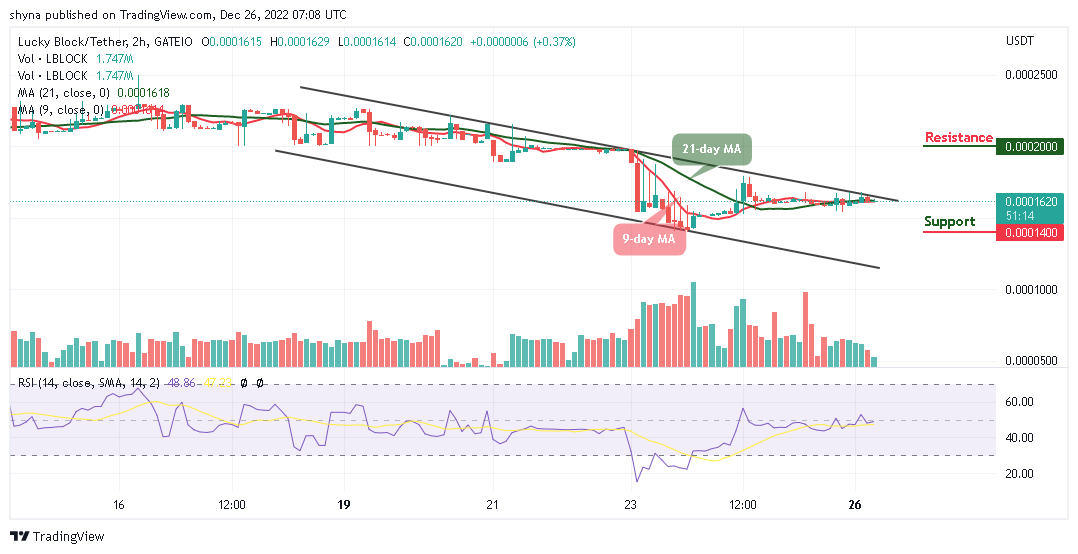
On the other hand, the technical indicator Relative Strength Index (14) is moving to cross above the 50-level, indicating that bullish signals are coming to play. Therefore, should bulls fail to increase the current market value above, the bears could step back into the market, and the nearest support level could be found at $0.000140 and below.
You can purchase Lucky Block here. Buy LBLOCK