Maker (MKR/USD) Is Trying to Establish a Bullish Base Above the $1000 Price Level
Estimated Reading Time: 3 minutes
Don’t invest unless you’re prepared to lose all the money you invest. This is a high-risk investment and you are unlikely to be protected if something goes wrong. Take 2 minutes to learn more
The Maker market broke out aggressively into the $1000 price zone from around the $650 price level at the end of June. This could be a sign that July will favor the Maker bulls, as they have been showing signs of dominance over the market since the beginning of July.
During this period, there has been heightened buying pressure and potential overbought conditions in the market. To this end, the bear market has lately been showing signs of reprisal, but this has not been enough to stop the strong bull market.
Maker Market Data
- MKR/USD Price Now: $1,026.11
- MKR/USD Market Cap: 1,003,959,041
- MKR/USD Circulating Supply: 977,631 MKR
- MKR/USD Total Supply: 977,631
- MKR/USD CoinMarketCap Ranking: #42
Key Levels
- Resistance: $1100, $1200, and $1300
- Support: $800, $7.0, and $700.
Price Prediction for Maker: The Indicators’ Point of View
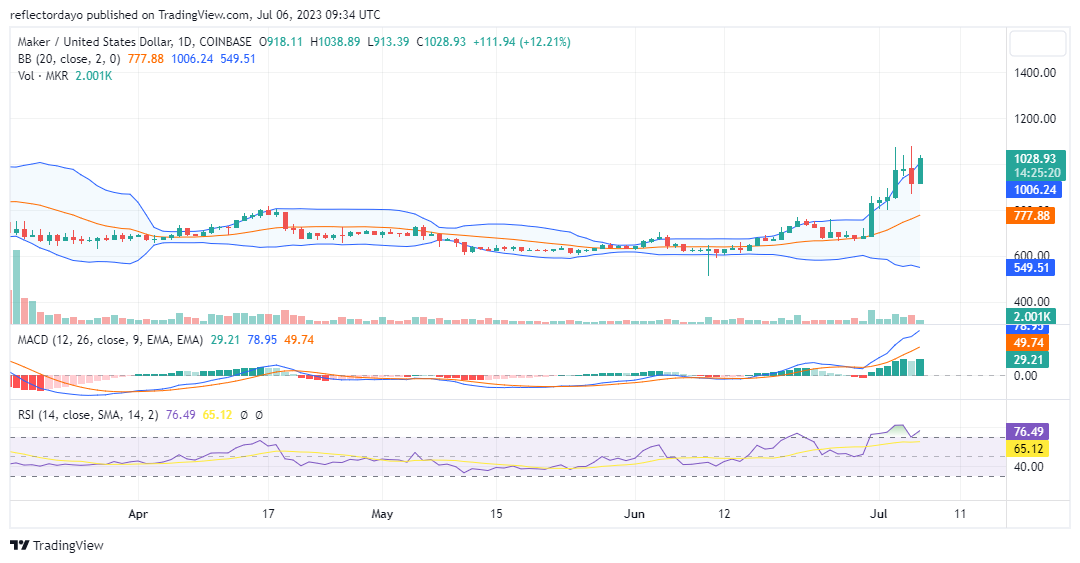
The price action is popping out of the Bollinger Bands indicator. The breach of the upper Bollinger Band indicates an extended price move beyond the typical volatility range. Such a move can often signal a continuation of the prevailing bullish trend or the onset of strong upward momentum. Maker traders and investors pay attention to this signal, as it suggests that buying pressure is strong and that the price may continue to rise.
However, it is important to note that as the market reached the $1083.73 price level, it experienced a pullback. This suggests that the Maker market may have encountered resistance or profit-taking at that particular price point. The recoil indicates a temporary pause in the bullish momentum and a potential shift towards a sideways or ranging market.
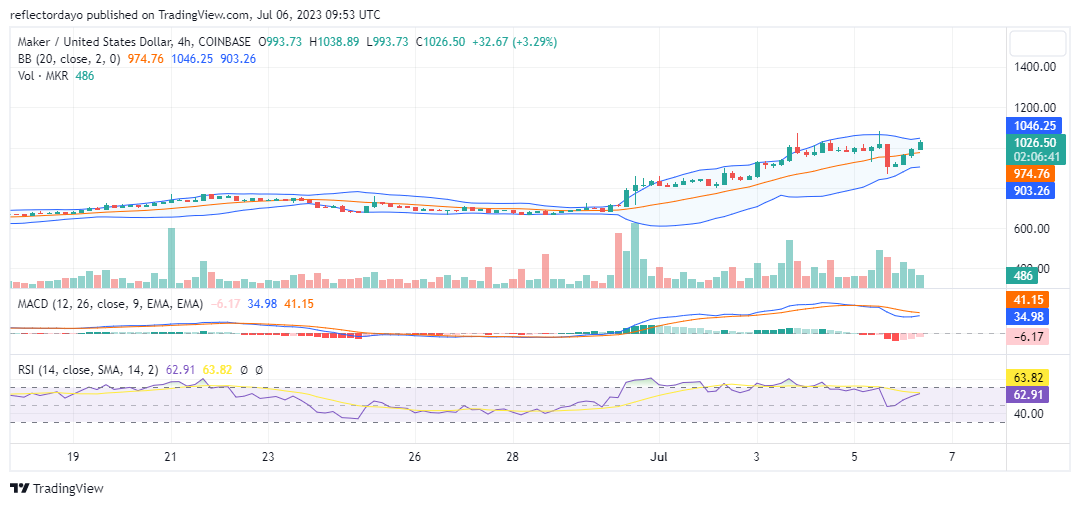
MKR/USD 4-Hour Chart Outlook
As the Maker market begins to range sideways around the $1000 level, it indicates a consolidation phase where neither the buyers nor the sellers have full control over the price direction. This range-bound movement can be seen as a period of indecision and often precedes a significant breakout or reversal.
Traders should monitor the $1000 level for price action. A break above recent highs or the upper Bollinger Band suggests a bullish continuation, while a break below key support levels indicates a potential shift to a bearish trend.