Neo (NEO/USD) Is on the Rise
Estimated Reading Time: 2 minutes
Don’t invest unless you’re prepared to lose all the money you invest. This is a high-risk investment and you are unlikely to be protected if something goes wrong. Take 2 minutes to learn more
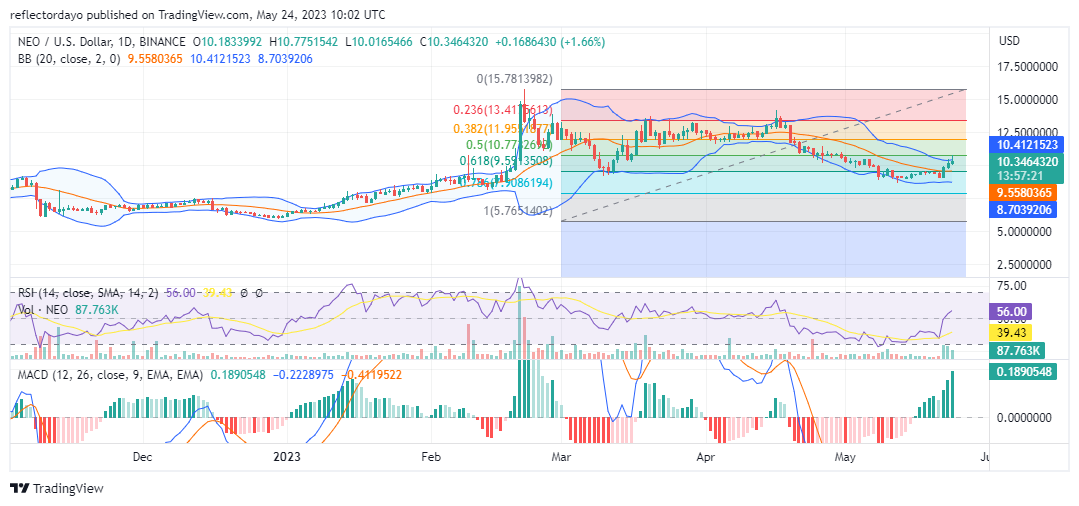
The Neo market has begun retracing the $10.77 price level, which it had fallen short of at the beginning of May. The $10.77 price level also acted as a strong checkpoint or support level that stopped the massive bear market of April. That was the downtrend that settled the market into the $10 and $9 price zones, with bulls clinging to the $8.6 price level. Bulls later used this level as the basis for the current market rise.
Neo Market Data
- NEO/USD Price Now: $10.26
- NEO/USD Market Cap: $723,424,520
- NEO/USD Circulating Supply: 70,538,831 NEO
- NEO/USD Total Supply: 100,000,000
- NEO/USD Coinmarketcap Ranking: #60
Key Levels
- Resistance: $11.00, $11.50, $12.00
- Support: $8.50, $8.00, $7.50
Price Prediction for NEO: The Indicators’ Point of View: Neo is on the Rise
The $9.6 support price level was also a strong fortress and the basis for the price rally in March; it is also the 61.8% Fibonacci retracement level. Therefore, the rise is more likely to continue, rallying above the $10.77 price level. Both the Relative Strength Index and the Moving Average Convergence and Divergence (MACD) indicators hold bullish recovery sentiment. However, as the market approaches the $10.77 price level, bearish sentiment grows because bears now form resistance around the level. In the Relative Strength Index (RSI), this was reflected as the RSI line shows a fall in momentum.
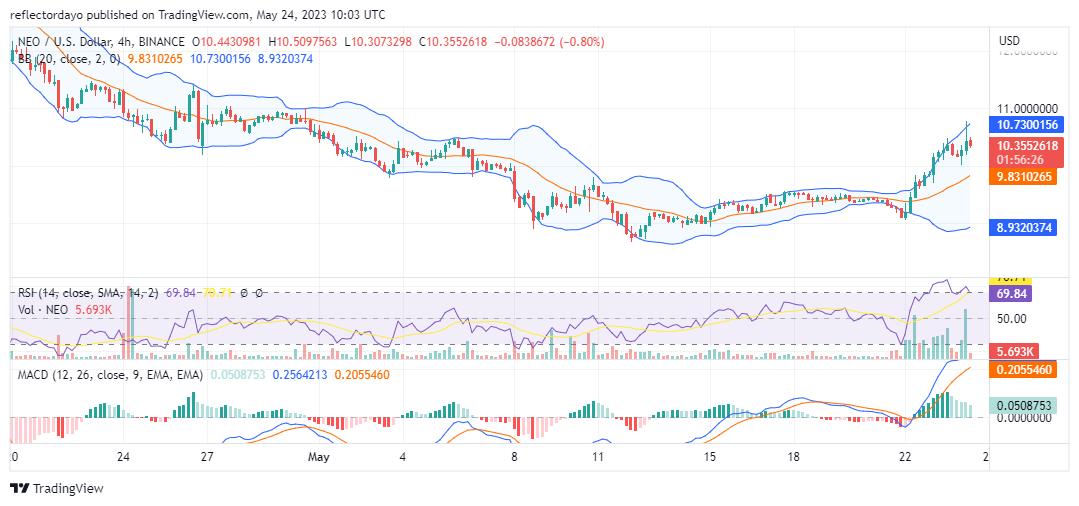
NEO/USD 4-Hour Chart Outlook: Aggressively On the Rise
The Neo Market began its upside journey as the daily trading session opened on May 22 and has continued ever since with very few signs of a bearish presence. But bears started responding to the aggression of the NEO/USD buyers on May 23. Such hyper-bullish movements like this will always trigger a response from the sell zone. Within a short while of the uptrend, the RSI line of the Relative Strength Index is already measuring in the overbought zone, which shows how strong the buying momentum is. Despite this, bulls still have the upper hand as they were still able to contain the price retracement above the 20-day moving average.
Buy Neo on eToro