Polkadot (DOT) Declines, Trades Marginally Above $22 Support
Estimated Reading Time: 2 minutes
Don’t invest unless you’re prepared to lose all the money you invest. This is a high-risk investment and you are unlikely to be protected if something goes wrong. Take 2 minutes to learn more
Polkadot (DOT) Long-Term Analysis: Bullish
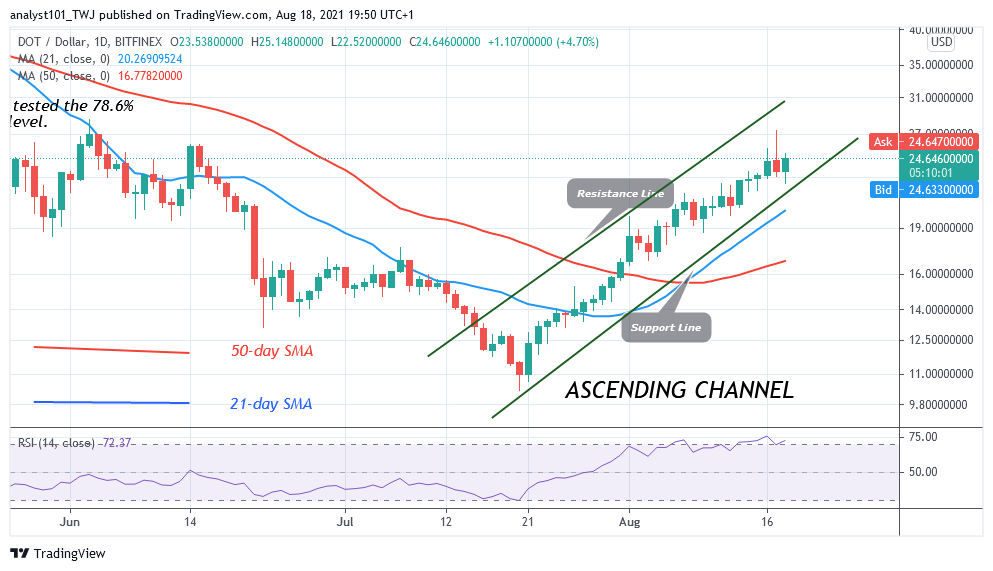
Polkadot’s (DOT) price reached the high of $27 on August 17 but
the price pulled back. DOT price retraced to $23.05. Today, the altcoin has resumed an upward move to retest the recent high. The uptrend will continue as long as price bars are above the moving averages. Polkadot is trading in the overbought region despite the retracement. Sellers are likely to emerge in the overbought region. On the upside, if buyers push DOT above the $27 resistance, the market will rally above $30. Otherwise, the crypto will be compelled to a range-bound move below the recent high.
Polkadot (DOT) Indicator Analysis
DOT price is at level 70 of the Relative Strength Index period 14. The crypto’s price bars are above the moving averages which suggest a further upward movement of the crypto. DOT price is below the 50% range of the daily stochastic. It indicates that the market is in a bearish momentum. The 21-day and 50-day SMA are sloping upward indicating the previous trend.
Technical indicators:
Major Resistance Levels – $48, $52, $56
Major Support Levels – $32, $28, $24
.
What Is the Next Direction for Polkadot (DOT)?
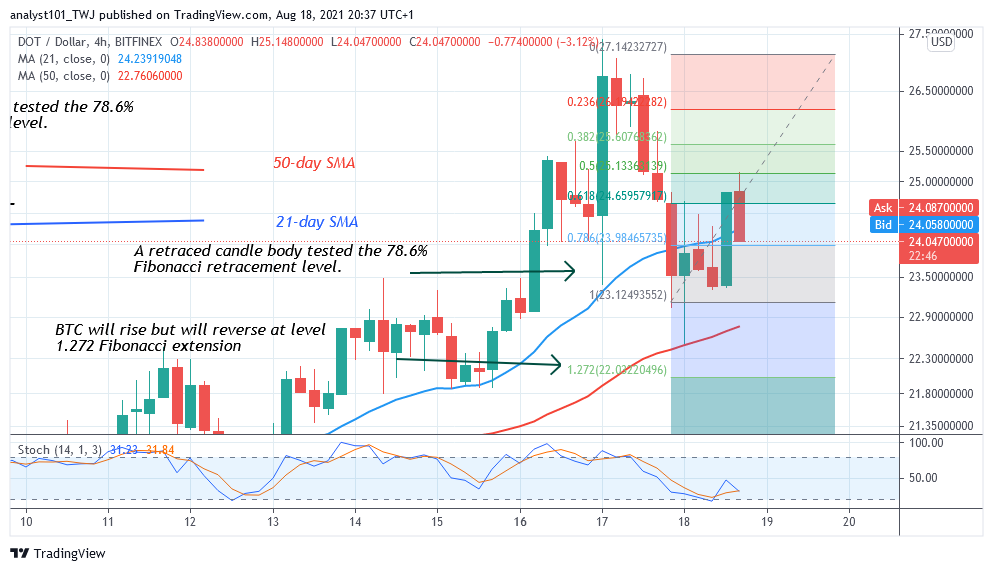
Polkadot’s price is in a downward move. The price has broken below the moving averages suggesting a possible down move of the coin. Meanwhile, on August 17 downtrend; a retraced candle body tested the 78.6% Fibonacci retracement level. The retracement indicates that the DOT price will fall but reverse at level 1.272 Fibonacci extension or level $22.02.
You can purchase crypto coins here. Buy Tokens
Note: Cryptosignals.org is not a financial advisor. Do your research before investing your funds in any financial asset or presented product or event. We are not responsible for your investing result