Polygon (MATIC/USD) Market Remains Below $1 Resistance
Estimated Reading Time: 3 minutes
Don’t invest unless you’re prepared to lose all the money you invest. This is a high-risk investment and you are unlikely to be protected if something goes wrong. Take 2 minutes to learn more

Free Crypto Signals Channel
Polygon Price Prediction – September 1
Fewer efforts have been applied in the buying spree of the MATIC/USD business activities as the crypto market remains below the $1 resistance line. It has been on the financial book of records the crypto economy trades around $0.894 at an average of -1.32 percent.
MATIC/USD Market
Key Levels
Resistance levels: $1, $1.10, $1.20
Support levels: $0.80, $0.70, $0.60
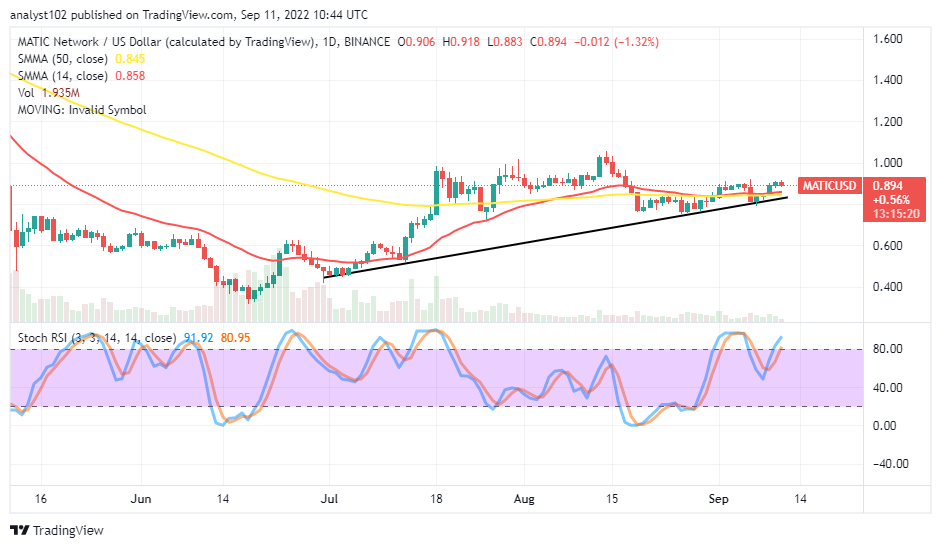
MATIC/USD – Daily Chart
The daily chart reveals the MATIC market remains below the $1 resistance level, trading against the market strength of the US Dollar. There has been that the SMA trend lines have conjoined as the 14-day SMA indicator is at $0.858 tightly over the 50-day SMA indicator, which is at a $0.845 value point. The bullish trend line drew beneath them to denote the trading outlook is relatively in a bullish mode. The Stochastic Oscillators are in the overbought region. And they are at the range values of 80.95 and 91.92.
Should the MATIC/USD market sellers begin executing selling orders by now?
The trading situation in the MATIC/USD market has been running weak around $0.90 or thereabout over a couple of times as the crypto’s price remains below the $1 resistance level. Those sentiments suggest bulls are liable to lose momentum even if a pull-up attempts to resurface toward the resistance point. Therefore, it would amount to unnecessary risk-taking to launch a buying order further while an indicator has pointed out an overbought trading condition for the business operations.
On the downside of the technical analysis, short-position placers in the MATIC/USD market operation may have to begin nursing the expectation that price will soon run back into a retracement-moving manner beneath or around the $1 resistance level. It could look indecently in time to start by now to launch selling orders, especially if traders will risk a high point of lot size for a position. As it is, some degrees of caution still need to exercise to get a reliable moment of presumed declining pattern afterward.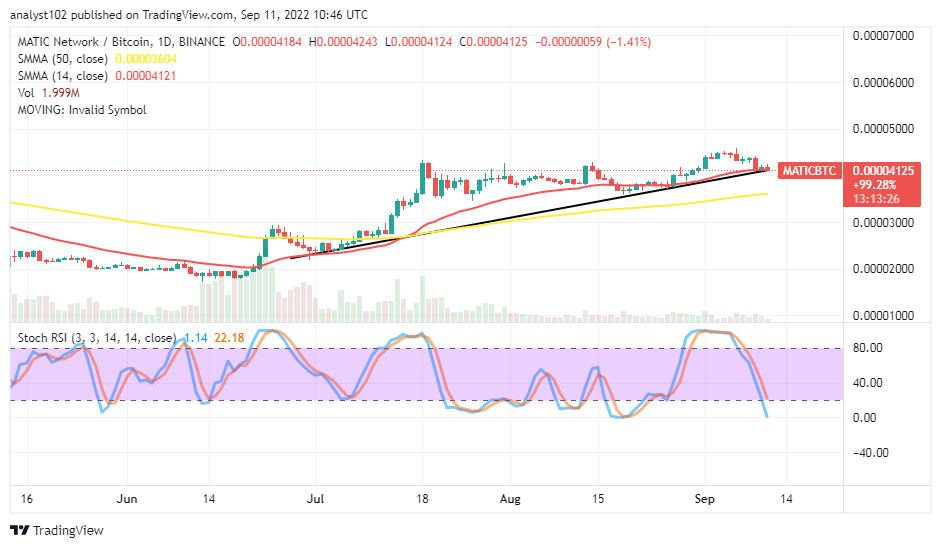
MATIC/BTC Price Analysis
Polygon (MATIC) has been holding higher in a relatively-moving manner compared with Bitcoin for quite a while. The cryptocurrency pair price has retraced to touch the buying signal side of the smaller SMA. The 50-day SMA indicator is underneath the 14-day SMA indicator. The bullish trend line drew to mark the lower point the market has been able to spring northwardly. The Stochastic Oscillators are in the oversold region, crossing to reach 22.18 and 1.14 range values. That denotes the base crypto is lowering on a lighter note to find its back against the counter-trading crypto.
Note: Cryptosignals.org is not a financial advisor. Do your research before investing your funds in any financial asset or presented product or event. We are not responsible for your investing results.
You can purchase Lucky Block here. Buy LBLOCK