The Bitcoin (BTC/USD) Price Attempts a Reverse, Beneath $45,000
Estimated Reading Time: 3 minutes
Don’t invest unless you’re prepared to lose all the money you invest. This is a high-risk investment and you are unlikely to be protected if something goes wrong. Take 2 minutes to learn more
Bitcoin Price Prediction – January 31
For about a week and some days, trade zones between $40,000 and $37,500 have produced a reliable crypto trade signal that has led the BTC/USD business to surge and attempt a reverse beneath the resistance line of $45,000.
Many bearish velocities are likely to play out for a while below the $45,000 mark until the blue side of the oscillators is relocated at lower trading zones to point back upward, as we will shortly be learning from most crypto signal-generating Telegram channels. Meanwhile, a shorting frenzy appears likely if the previously indicated overhead barrier line stays intact to the upside.
BTC/USD Market
Key Levels:
Resistance levels: $45,000, $47,500, $50,000
Support levels: $40,000, $37,500, $35,000
BTC/USD – Daily Chart
The BTC/USD daily chart reveals that the crypto market attempts a reverse beneath the resistance line of $45,000.
The Bollinger Band trend lines have continually repositioned easterly at higher trade points bordering around 445,000 and $37,500. The stochastic oscillators are now featuring the blue part in the overbought region to signal that there is a need for bulls to be cautious about putting more efforts into pushing northward.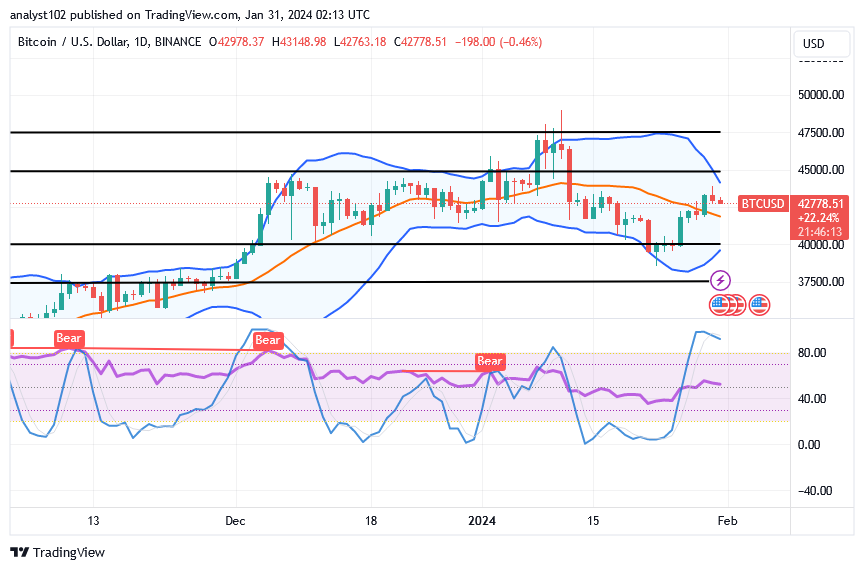
Should the bear market for Bitcoin/USD continue to decline from its current trading range of about $43,000?
It would make better sense to play alongside an active falling force from the present trade zone of $42,778.51, given that the BTC/USD price attempts a reverse beneath the barrier-trading line of $45,000.
As things are, a correctional motion is frequently taken to remind customers to wait a while. Only long-term investors are anticipated to hold onto their positions given the current conditions. In brief, long-position placers shouldn’t overtake their positions, in contrast to that idea.
Since an inverted candlestick has formed below the $45,000 mark, sellers should act quickly, as the market will likely move quickly in response to that signal. When playing alongside the declining force, traders should be cautious of any sudden movements that may eventually hint at more stable rallying motions above the problematic position.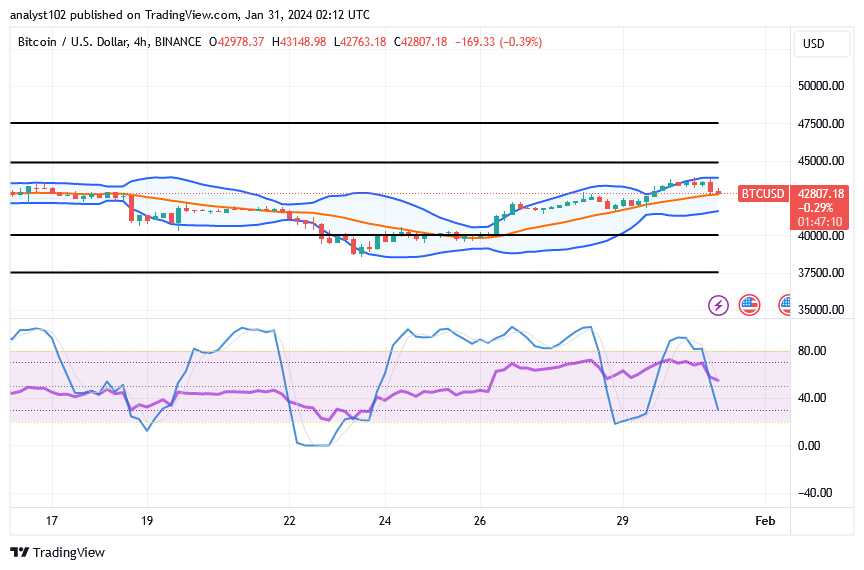
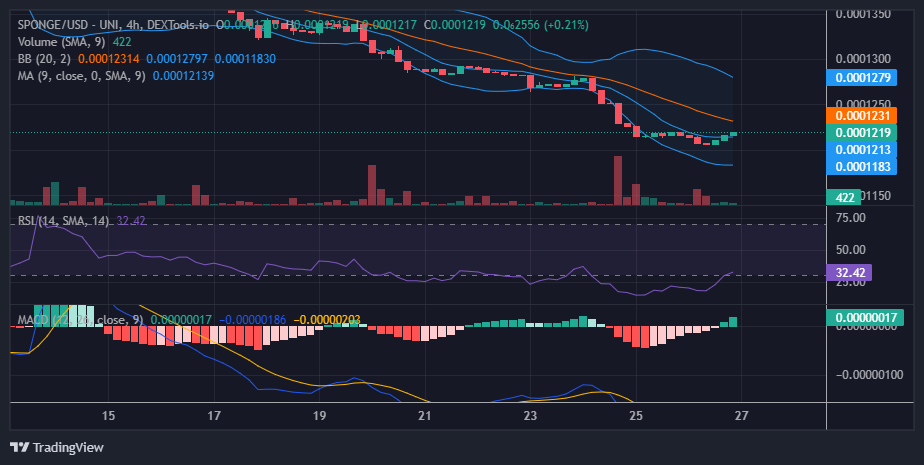
BTC/USD 4-hour Chart
The BTC/USD 4-hour chart showcases the cryptocurrency market attempting a reverse beneath the line of $45,000.
In an attempt to approach the line of 20 in the near future, the stochastic oscillators have crossed over to the south and are now positioned around the line of the point of 40. The trend lines of the Bollinger Band have managed to move somewhat northward. For the moment, candlestick appearances based on four hours have been bearish. The lower Bollinger Band and $40,000 have been chosen as the underlying supports. Buyers will continue to hold their positions on that trade line.
Note: Cryptosignals.org is not a financial advisor. Do your research before investing your funds in any financial asset or presented product or event. We are not responsible for your investing results.
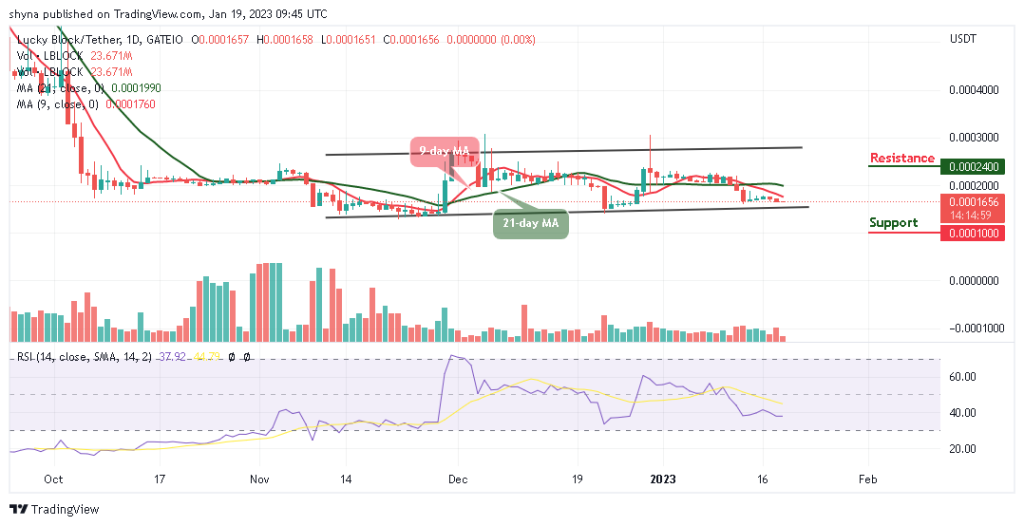
You can purchase Lucky Block here. Buy LBLOCK