The Bitcoin (BTC/USD) Trade Loses Points, Bumping a Base
Estimated Reading Time: 4 minutes
Don’t invest unless you’re prepared to lose all the money you invest. This is a high-risk investment and you are unlikely to be protected if something goes wrong. Take 2 minutes to learn more
Bitcoin Price Prediction – January 24
Anear assessment procession has been technically observed in the exchanging line activities of the business operations of Bitcoin versus the market valuation of the US coin as bulls are getting a resettling pattern, given that the crypto economy trade currently loses points, bumping a base up above the underlying support of $37,500.
The market’s velocity in the previous few days prompted a corrective step that might have occasionally caused a full depressurization of the transaction lines. According to the way the daily candlesticks have been forming since yesterday’s session, bulls in the market should be able to gather the necessary momentum to push back into recovery moves, whether they are short-term or long-term, as long as no more sell-off is permitted to occur between the middle and lower Bollinger Bands.
BTC/USD Market
Key Levels:
Resistance levels: $42,500, $50,000, $52,500
Support levels: $37,500, $36,500, $35,500
BTC/USD – Daily Chart
The BTC/USD daily chart reveals that the crypto-economic trade loses points downward to average the point of $37,500, bumping a base around the point of $40,000.
The present trade situation is showcasing that the market line has been relatively hovering around the lower Bollinger Band trend line with a lesser force to back any possible more falls in the course of doing it. To indicate an affirmatory note to that effect, the stochastic oscillators have found their way down into the oversold region.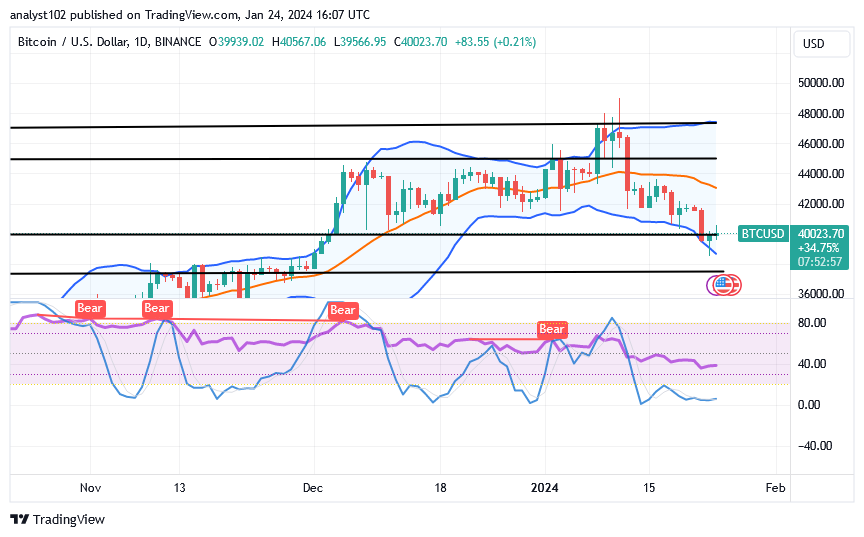
If the market is currently oversold, should bears in the Bitcoin/USD market continue to press against $40,000?
As of the time of this psychological piece, the motion on the marketer has been running in a pause moment, as that could cause an indecision for a while, given that the chief BTC/USD market currently loses points, bumping a base.
Contrary to investors’ tendency to start adding to the size of their position sizes in the BTC’s current trading zone, long-position placers are advised to follow price action techniques to support their entry whenever there is a chance of increasing gravitational pressure.
Sellers have the tendency to experience additional downward pressure, especially in cases where the market is to move slowly and steadily for some time. It would make perfect sense to assume that bears may put muscles out at a later time in light of the notion that they will materialize if bulls get weakened along the line.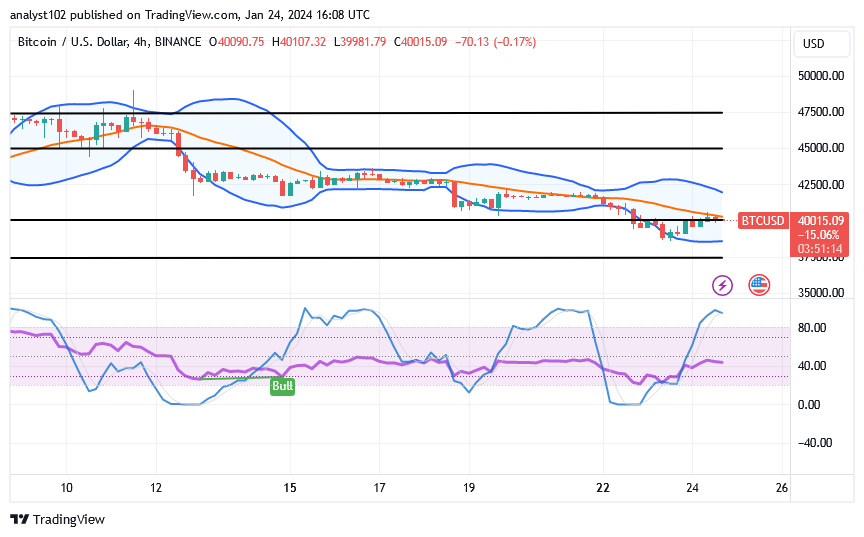
BTC/USD 4-hour Chart
The BTC/USD 4-hour chart reveals the crypto market loses points initially close to $37,500, bumping a base around the lower Bollinger Band.
The whole part of the Bollinger Bands has been systemically placed southerly to showcase most of the strategical bargaining values that have been involved in the ups and downs, as it suits the trend. Based on the hourly technical outlook assessment, the market has a tendency to surge higher, indicating that any new falling force could trigger a series of corrections, particularly from around its point in the middle Bollinger band zone, as an overbought condition has been demonstrated by the presence of stochastic oscillators in the overbought region.
Note: Cryptosignals.org is not a financial advisor. Do your research before investing your funds in any financial asset or presented product or event. We are not responsible for your investing results.
You can purchase Lucky Block here. Buy LBLOCK