Polygon (MATIC/USD) Price Precipitations Fall Between $1 and $0.70
Estimated Reading Time: 3 minutes
Don’t invest unless you’re prepared to lose all the money you invest. This is a high-risk investment and you are unlikely to be protected if something goes wrong. Take 2 minutes to learn more
Polygon Price Prediction – November 20
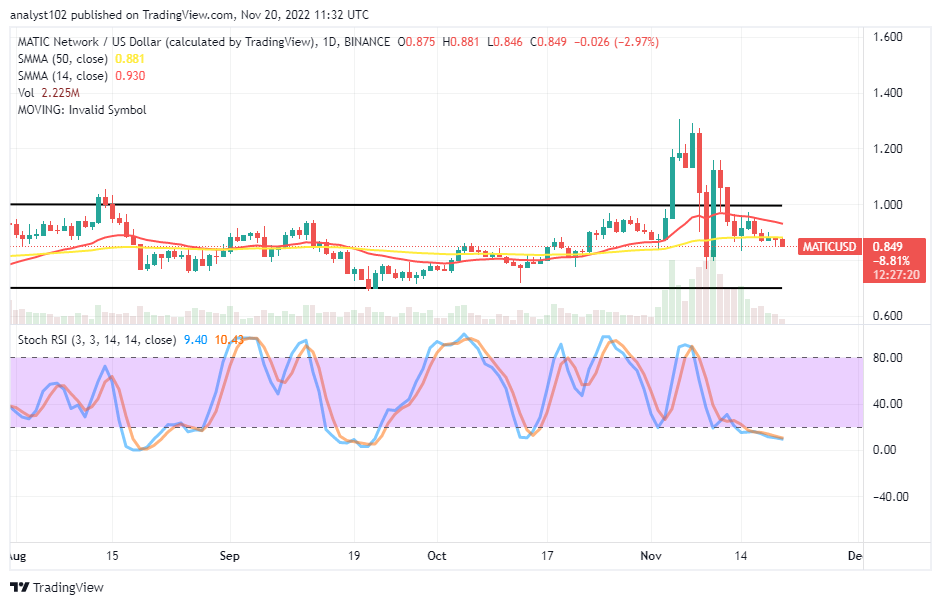
The presently obtainable trading outlook in the MATIC/USD market operation showcases the crypto-economic price precipitations fall between $1 and $0.70 in a manner of downward-trending continuation as of the time of writing. The market suffers a loss of about 2.97 percentage rates, trading between $0.881 and $0.846 value-lines.
MATIC/USD Market
Key Levels
Resistance levels: $0.90, $1, $1.10
Support levels: $0.70, $0.65, $0.60
MATIC/USD – Daily Chart
The MATIC/USD daily chart displays the crypto-economic price precipitations fall between $1 and $0.070. The 14-day SMA indicator is at a $0.930 value line above the $0.881 point of the 50-day SMA indicator. The Stochastic Oscillators have dipped their lines into the oversold region, keeping 9.40 and 10.43 levels somewhat to the upside to signify that an upward-moving mode is in the offing. However, the formation of a bearish candlestick in the making requests that bulls should exercise caution until an active impact features to generate a bounce-off motion for buying entries.
Will the MATIC/USD trade cause price precipitations to rise above the $0.70 support range?
It has been that the MATIC/USD price precipitations fall between the $1 and $0.70 levels, forming specific range-bound spots. The current reading of the Stochastic Oscillators has given insight into saying that it is worthy of investing. On the contrary, long-position placers still need to wait for an emergence of a bullish candlestick to nullify the probability of seeing the market pushing southward further below the SMA trend lines.
On the opposing side to the upside of the technical analysis, the present bearish candlestick emanating from the trend line of the 50-day SMA has set a direction to the south, creating a near-resistance trait around the trading indicator. Sellers’ reactions at this point have to be intensely pressing southward below the bigger SMA on at least a medium-term basis though a sudden bounce-off trading situation may occur in no time.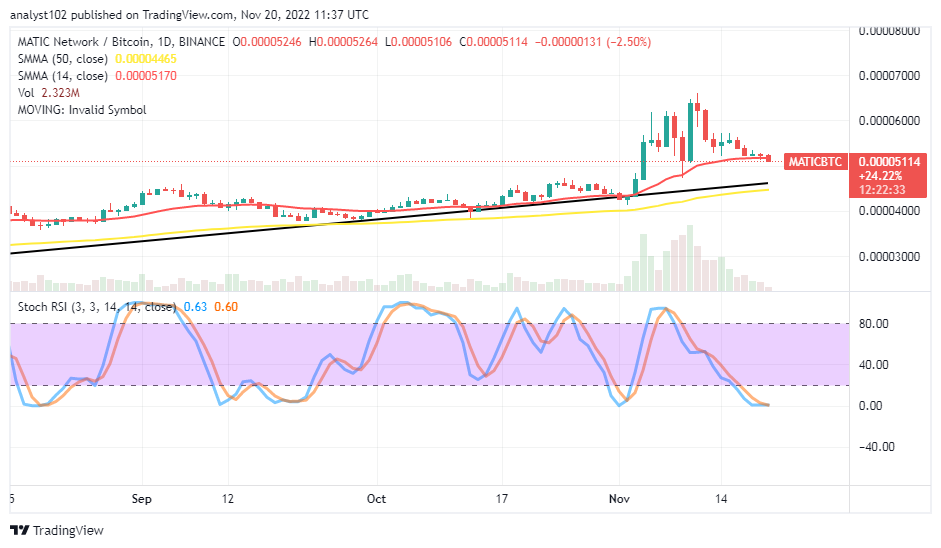
MATIC/BTC Price Analysis
In comparison, Polygon has concurrently kept in check in a correction mode against the trending ability of Bitcoin in a bullish outlook around the trend line of the smaller SMA. The 14-day SMA indicator is above the 50-day SMA indicator. And they are pointing toward the north to affirm that the former trading instrument hasn’t downsized out of regaining upward forces against its latter trading tool. The Stochastic Oscillators are in the oversold region, positioning at 0.60 and 0.63 levels to signify the base crypto is striving to push against the counter crypto.
Note: Cryptosignals.org is not a financial advisor. Do your research before investing your funds in any financial asset or presented product or event. We are not responsible for your investing results.
You can purchase Lucky Block here. Buy LBLOCK