Polygon (MATIC/USD) Price Reverts to a Correction
Estimated Reading Time: 3 minutes
Don’t invest unless you’re prepared to lose all the money you invest. This is a high-risk investment and you are unlikely to be protected if something goes wrong. Take 2 minutes to learn more

Free Crypto Signals Channel
Polygon Price Prediction – August 21
It has portrayed that the Polygon market operation reverts to a correction, trading alongside the market-purchasing strength of the US coin. The market is trading at a minute negative percentage rate of 0.31 around the $0.783 value line at the time of writing.
MATIC/USD Market
Key Levels
Resistance levels: $1, $1.10, $1.20
Support levels: $0.75, $0.70, $0.65
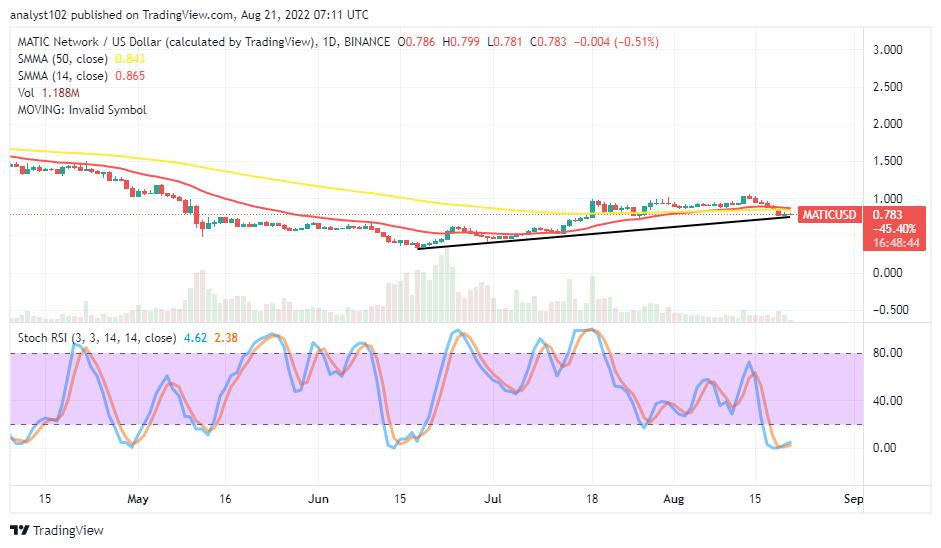
MATIC/USD – Daily Chart
The daily chart reveals MATIC trade activity reverts to a correction against the market-trading weight of the US Dollar. Some candlesticks have formed closely below the trend lines of the SMAs to denote how intense the downward motion is. The 14-day SMA indicator is tightly placed at $0.865 over the $0.843 point of the 50-day SMA indicator. The bullish trend line drawn beneath the SMAs shows that the trend is relatively signaling that some upward traits are still on. The Stochastic Oscillators have dipped into the oversold region, maintaining the ranges between 4.62 and 2.38 within.
Will the MATIC/USD market precipitate long below the SMAs’ value points?
The MATIC/USD market may lack the required trending forces to make a sustainable outcome, trying to push down against variant support levels below the bullish trend line drawn as the crypto’s price reverts to a correction from a high point around the $1 resistance level recently. It appears all is getting set for long-position placers to start getting repositioning to make a come-back soon. But, they have to be wary of a sudden aggressive force that can impair getting a decent buying entry around the bullish trend line drawn.
On the downside of the technical analysis, as there has been an oversold-reading condition to some reasonable extent, the MATIC/USD market sellers need to be cautious of exerting another round of selling orders at the moment to avoid unnecessary bears’ traps afterward. However, the selling order opened around $1 in the past has to trail or the entry needs to be brought to break even in other to safeguard any unprecedented event that can trigger price through variant resistances.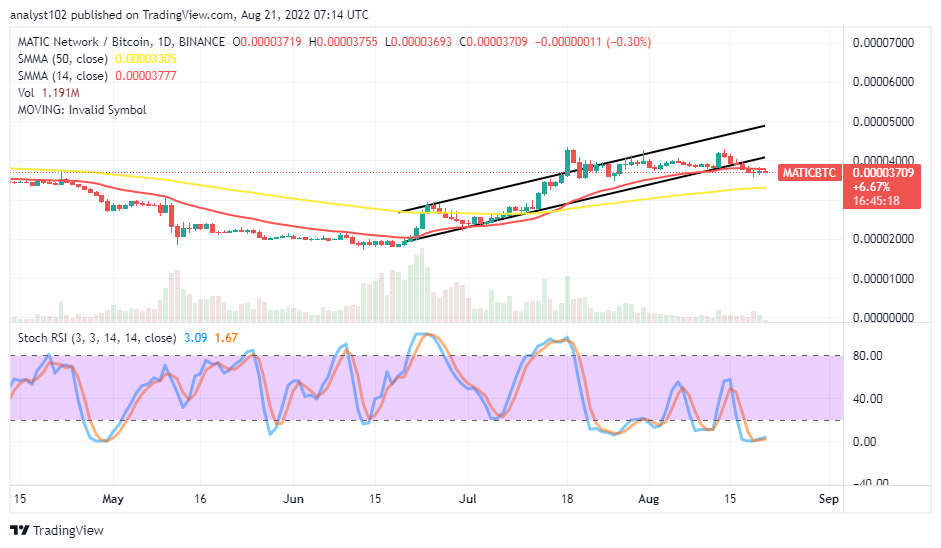
MATIC/BTC Price Analysis
MATIC’s price seems to be on the verge of relaxing against the trending catalyst of Bitcoin. The cryptocurrency pair price reverts to a correction, pushing out of the bullish trend channels drawn. The 14-day SMA indicator is above the 50-day SMA indicator. The Stochastic Oscillators are in the oversold region, maintaining the range points of 3.09 and 1.67 within. They have crossed northbound in a slight-conjoining mode to suggest the base crypto tends to strive to regain some momentum against its counter-trading crypto.
Note: Cryptosignals.org is not a financial advisor. Do your research before investing your funds in any financial asset or presented product or event. We are not responsible for your investing results.
You can purchase Lucky Block here. Buy LBLOCK