Bitcoin (BTC/USD) Price Rebounds, Hovering at $50,000
Don’t invest unless you’re prepared to lose all the money you invest. This is a high-risk investment and you are unlikely to be protected if something goes wrong. Take 2 minutes to learn more
Bitcoin Price Prediction – December 8
The BTC/USD market operations have been slowly and steadily rebounding northward after experiencing a significant downing as the crypto’s price is currently hovering at the $50,000 line. The market experiences a negative percentage rate of about 2.29, trading around $49,400 as of writing.
BTC/USD Market
Key Levels:
Resistance levels: $52,500, $55,000, $57,500
Support levels: $47,500, $45,000, $42,500
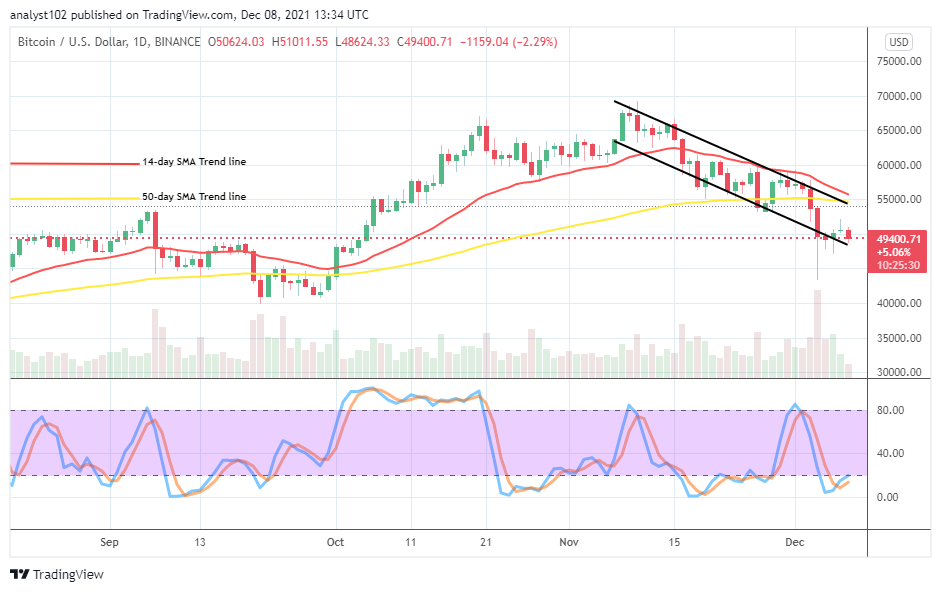
BTC/USD – Daily Chart
The BTC/USD daily chart showcases that the crypto-economic price rebounds, hovering at the $50,000 market level. The lower bearish channel trend line drew to make the value-line the critical trading spot as the two market movers yet push the operations into a definite direction. The 50-day SMA indicator is at the $55,000 level as the 14-day SMA indicator is still somewhat in the process of closing the gap southward above it. The BTC/USD daily chart showcases that the crypto-economic price rebounds, hovering at the $50,000 market level. The lower bearish channel trend line drew to make the value-line the critical trading spot as the two market movers yet push the operations into a definite direction.
Is it technically inclined that traders needed to wait for a price action before taking a position as the BTC/USD business economic price rebounds, hovering at $50,000?
It would be highly technically inclined that the BTC/USD market traders wait for a price action before deciding on a position ordering as the crypto business economic price rebounds, hovering at the $50,000 level. Presumably, in the next couple of days’ sessions, $50,000 and $45,000 trading levels are likely to embody support-finding efforts that the market will be striving to make.
On the downside of the technical analysis, the BTC/USD market sellers may still use resistance levels a bit above the $50,000 to re-launch their presence in the crypto trading activities. The market resistance level at $55,000, may for a while, pose a warning signal against getting to seeing more sustainable ups, especially while there is no volatility force backing upside motions in the process.
BTC/USD 4-hour Charts
The BTC/USD medium-term chart shows that the market is in a bearish trending outlook as the crypto-economic price rebounds, hovering at the $50,000 level. The 50-day SMA trend line is above the 14-day SMA trend line. The Stochastic Oscillators are bending southbound close to the range of 40. That signifies that the market may still witness some smaller-downs to build solid grand for aftermath sustainable upswings at later sessions. Based on that assumption, traders would have to exercise patience by staying alert to observe price action that will be in for the upside forces before launching long positions afterward.
Note: Cryptosignals.org is not a financial advisor. Do your research before investing your funds in any financial asset or presented product or event. We are not responsible for your investing results.
You can purchase crypto coins here. Buy Tokens