Polygon (MATIC/USD) Market Trades Values Under SMAs
Estimated Reading Time: 3 minutes
Don’t invest unless you’re prepared to lose all the money you invest. This is a high-risk investment and you are unlikely to be protected if something goes wrong. Take 2 minutes to learn more
Polygon Price Prediction – November 28
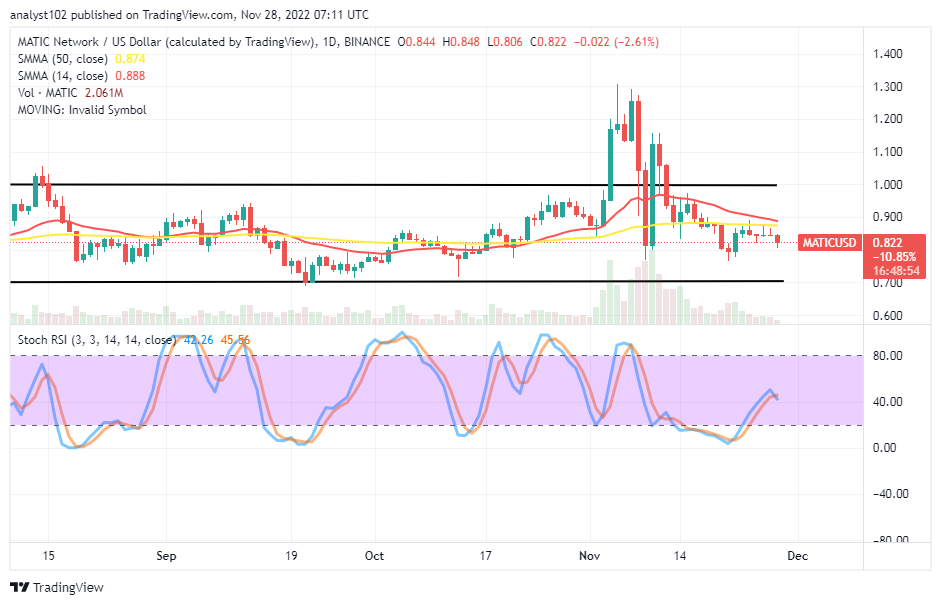
Trading activities between buyers and sellers of the MATIC/USD economic operations have remained to make the crypto market trade values under SMAs. The high and the low trading zones are seeable in $0.848 and $0.806 as the price keeps a negative percentage rate of 2.61 at the time of writing.
MATIC/USD Market
Key Levels
Resistance levels: $0.90, $1, $1.10
Support levels: $0.70, $0.65, $0.60
MATIC/USD – Daily Chart
The MATIC/USD daily chart showcases the crypto market trades values under SMAs in definite range-bound zones. The lower horizontal line drew at the $0.70 support level, and the upper horizontal line was drawn around $1.The 14-day SMA indicator is at $0.888, closely above the $0.874 value line of the 50-day SMA indicator. The Stochastic Oscillators are attempting to cross back northbound near the range of 40. And they keep positions of 45.56 and 42.26 slightly to the downside.
Will the MATIC/USD market continue to trade values below the SMA points in the following session?
On November 22 trading session, a bullish candlestick emerged to create a buying wall from a lower-trading of the SMAs as the crypto market now trades values under the indicators to show that a decline-moving mode is somewhat ongoing. Given the current situation, a fall of $0.80 is required for the price to restore its potential to rise. On the way around, long-position placers are to be on the lookout for a rebounding move that can emanate at any point of the trading spot before rejoining the ride back to the upside direction afterward.
On the contrary side to the upside of the technical analysis, the MATIC/USD market sellers will have to intensify efforts not to let the price push fearfully sustainable against the values of the SMAs, especially against the $0.90 resistance level. Bears should also be cautious about executing shorting orders after they are supposed to whenever they see fit. The market might, however, permit running to close off any potential short bets.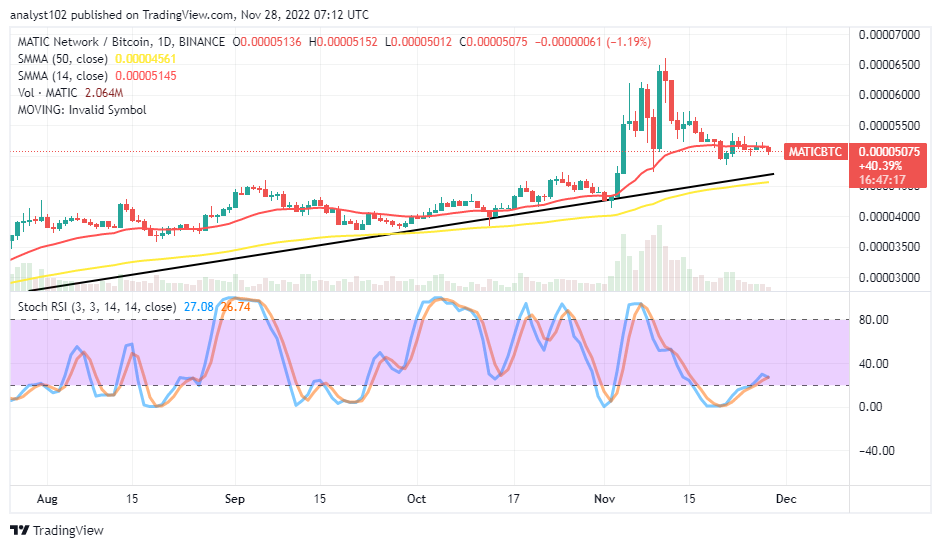
MATIC/BTC Price Analysis
In comparison, Polygon remains less-actively, shifting the base to a lower-trading point around the smaller SMA in a bullish outlook against Bitcoin. The market for paired cryptocurrencies trades values tightly under the smaller indicator. Underneath the 14-day SMA trend line is the 50-day SMA trend line. And more of them than any other direction are pointing in the north. The Stochastic Oscillators have bent northbound from the oversold region against the range of 40. And they are trying to cross slightly back to the down side at 27.08 and 26.74 levels.
Note: Cryptosignals.org is not a financial advisor. Do your research before investing your funds in any financial asset or presented product or event. We are not responsible for your investing results.
You can purchase Lucky Block here. Buy LBLOCK