Quant Price Prediction: QNT/USD Becomes Cheap; More Buyers Will Play Out
Estimated Reading Time: 3 minutes
Don’t invest unless you’re prepared to lose all the money you invest. This is a high-risk investment and you are unlikely to be protected if something goes wrong. Take 2 minutes to learn more
Quant Price Prediction – October 20
The Quant price prediction shows that QNT will begin to move higher as soon as the bulls return to the market.
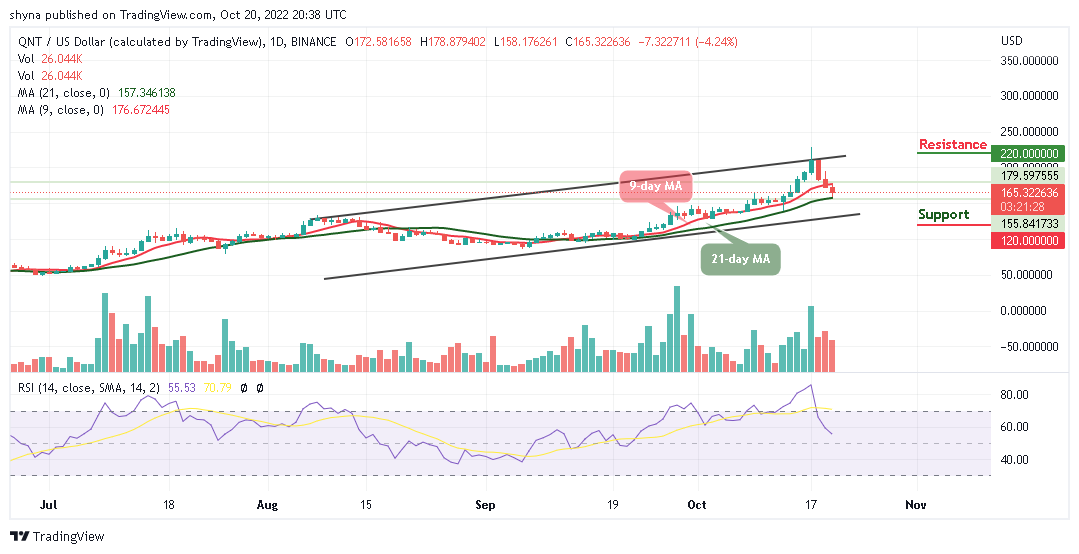
QNT/USD Medium-term Trend: Ranging (1D Chart)
Key Levels:
Resistance levels: $220, $230, $240
Support levels: $120, $110, $100
At the time of writing, QNT/USD is trading within the 9-day and 21-day moving averages as the market price hovers at the $165 level. In the short while, the Quant price can stay below the moving averages so that new investors can come into the market.
Quant Price Prediction: QNT/USD Will Break to the Upside
The Quant price will rise above the 9-day moving average and break toward the upper boundary of the channel. However, as soon as the bulls push the coin above the upper boundary of the channel, it could hit the resistance levels at $220, $230, and $240.
On the other hand, this prediction can be delayed if the bears increase the selling pressure, and this could cause the market price to hit the support levels of $120, $110, and $100. Moreover, the technical indicator Relative Strength Index (14) is below the 60-level, which could prepare the coin for a bullish movement.
QNT/USD Medium-term Trend: Bullish (4H Chart)
Against the 4-hour chart, the Quant price will continue to head to the upside as the coin moves to cross above the 9-day and 21-day moving averages. However, according to the chart, the long-term moving averages will begin the bullish movement as the market prepares for a new trend.
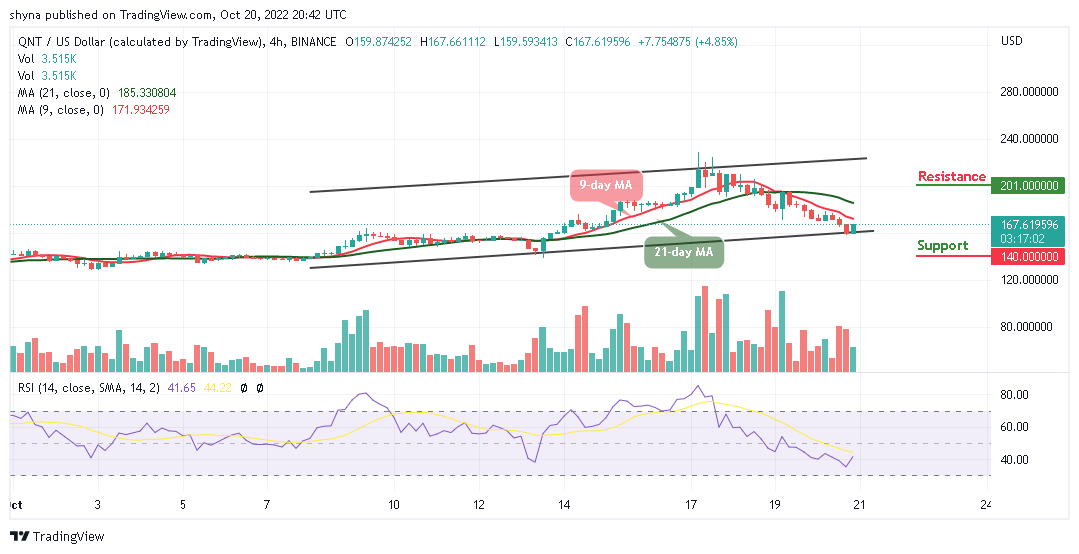
Meanwhile, if the buyers push the price above the moving averages, the potential resistance could be located at $201 and above as the technical indicator Relative Strength Index (14) crosses above the 40-level. Moreover, should the bulls fail to move the current market value above, the bears may step into the market, and the nearest support level could be found at $140 and below.
Place winning Quant trades with us. Get QNT here:
https://med.etoro.com/B13974_A81931_TClick_Slearn2trade.aspx