Quant Price Prediction: QNT/USD Climbs Above $120 Resistance
Estimated Reading Time: 3 minutes
Don’t invest unless you’re prepared to lose all the money you invest. This is a high-risk investment and you are unlikely to be protected if something goes wrong. Take 2 minutes to learn more
Quant Price Prediction – January 9
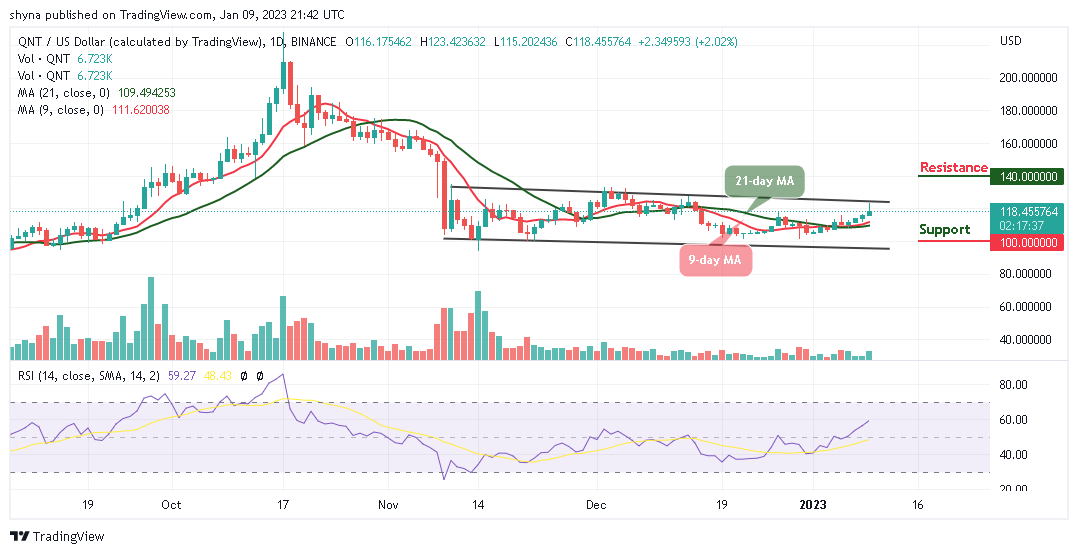
As the daily chart reveals, the Quant price is trading near the resistance level of $120 as the recovery comes slowly.
QNT/USD Long-term Trend: Ranging (Daily Chart)
Key levels:
Resistance Levels: $140, $150, $160
Support Levels: $100, $90, $80
QNT/USD is seen trading at $118.4 above the 9-day and 21-day moving averages. As seen on the daily chart, the Quant price will create additional gains if the bulls increase the buying pressure and the crosses above the upper boundary of the channel.
Quant Price Prediction: Quant (QNT) Could Spike to the North
On the bullish side, the Quant price needs to stay above the 9-day and 21-day moving averages, otherwise, there may come a bearish breakdown if QNT/USD slide below the $115 support. The 9-day MA crosses above the 21-day MA as the technical indicator Relative Strength Index (14) keeps sending a moderate sign where the signal line moves to cross above the 60-level. However, QNT/USD will confirm the bullish trend if the market price touches the nearest resistance level at $125.
On the contrary, the Quant price may follow the bearish trend if the price retreats below the moving averages and face the lower boundary of the channel. Should this come to focus, QNT/USD could hit the critical supports at $100, $90, and $80 respectively. Otherwise, a strong bullish spike may surface, which could push the price above the upper boundary of the channel as the resistance levels are located at $140, $150, and $160.
QNT/USD Medium-Term Trend: Bullish (4H Chart)
Looking at the 4-hour chart, the Quant price is likely to cross below the 9-day and 21-day moving averages if the selling pressure increases. However, if the price begins to rise further and crosses above the upper boundary of the channel, it could reach the nearest resistance level at $125 and above.
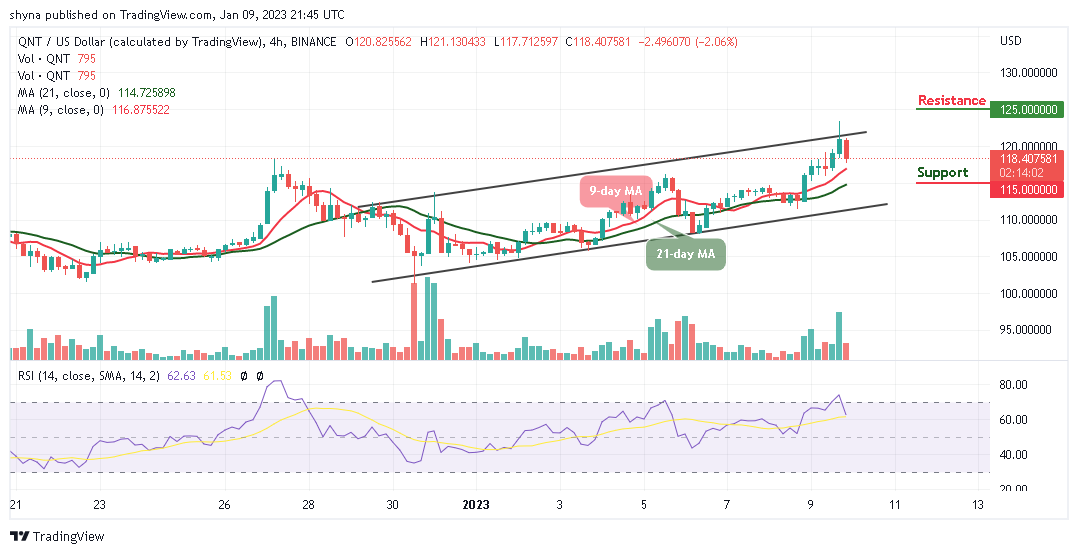
Meanwhile, if the bears bring the coin below the moving averages, the price of Quant could touch the closest support at $115 and below. At the moment, the technical indicator Relative Strength Index (14) is likely to cross below the 60-level, which could confirm the bearish movement in the market.
Place winning Quant trades with us. Get QNT here