Ripple Is in a Sideways Move, Faces Resistance at $0.80
Estimated Reading Time: 2 minutes
Don’t invest unless you’re prepared to lose all the money you invest. This is a high-risk investment and you are unlikely to be protected if something goes wrong. Take 2 minutes to learn more

Free Crypto Signals Channel

Ripple (XRP) Long-Term Analysis: Bearish
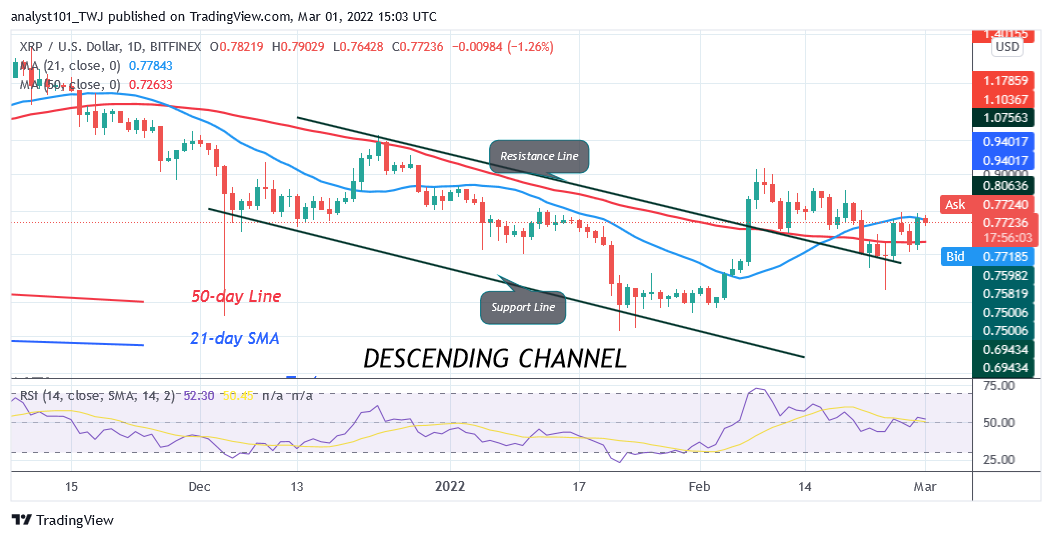
Ripple’s (XRP) price is in a downtrend but faces resistance at $0.80. XRP price is below the 21-day line moving average but above the 50-day line moving average. Ripple will trend when the range-bound levels are broken. Currently, the upward move is hindered at the $0.80 high. The cryptocurrency will rise and retest or break the resistance at $0.90 and $1.00 if the initial resistance is cleared. The crypto will be out of the downward correction if the bulls breach the $1.00 overhead resistance. The cryptocurrency is trading at $0.77 at the time of writing.
Ripple (XRP) Indicator Analysis
XRP is at level 52 of the Relative Strength Index for period 14. The altcoin is in the uptrend zone and capable of a further upward move. Ripple price bars are below the 21-day line moving average but above the 50-day line moving average. This implies that the altcoin will be compelled to a range-bound move for a few more days.
Technical indicators:
Major Resistance Levels – $2.00, $2.50, $3.00
Major Support Levels – $1.50, $1.00, $0.50
What Is the Next Direction for Ripple (XRP)?
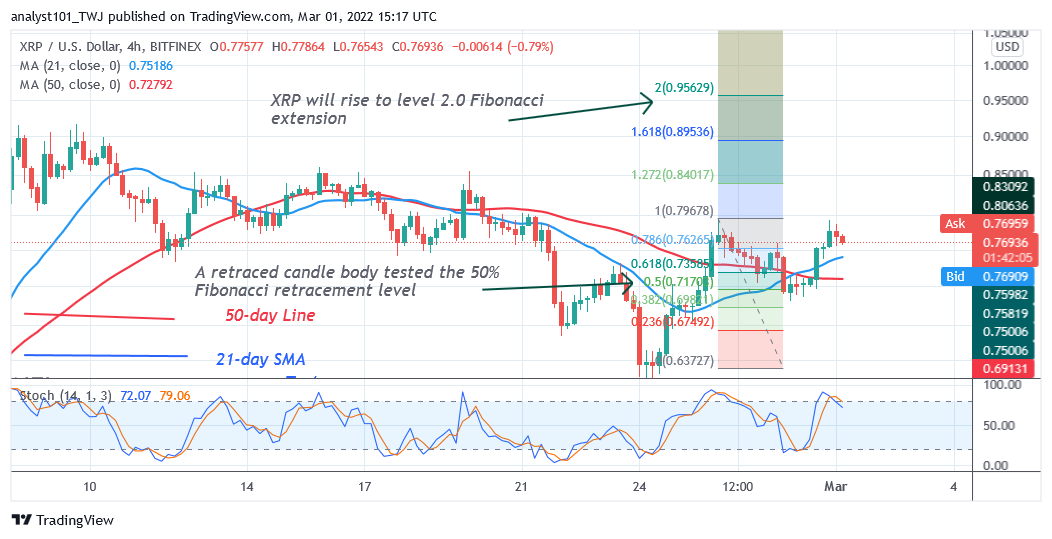
On the 4 –hour chart, XRP is in an uptrend but faces resistance at $0.80. Meanwhile, on February 26 uptrend; a retraced candle body tested the 50% Fibonacci retracement level. The retracement indicates that XRP will rise to level 2.0 Fibonacci extension or $0.95.
You can purchase crypto coins here. Buy LBlock
Note: Cryptosignals.org is not a financial advisor. Do your research before investing your funds in any financial asset or presented product or event. We are not responsible for your investing results