Ripple Resumes Selling Pressure as It Faces Rejection at the $0.42
Estimated Reading Time: 2 minutes
Don’t invest unless you’re prepared to lose all the money you invest. This is a high-risk investment and you are unlikely to be protected if something goes wrong. Take 2 minutes to learn more

Free Crypto Signals Channel
Ripple (XRP) Long-Term Analysis: Bearish
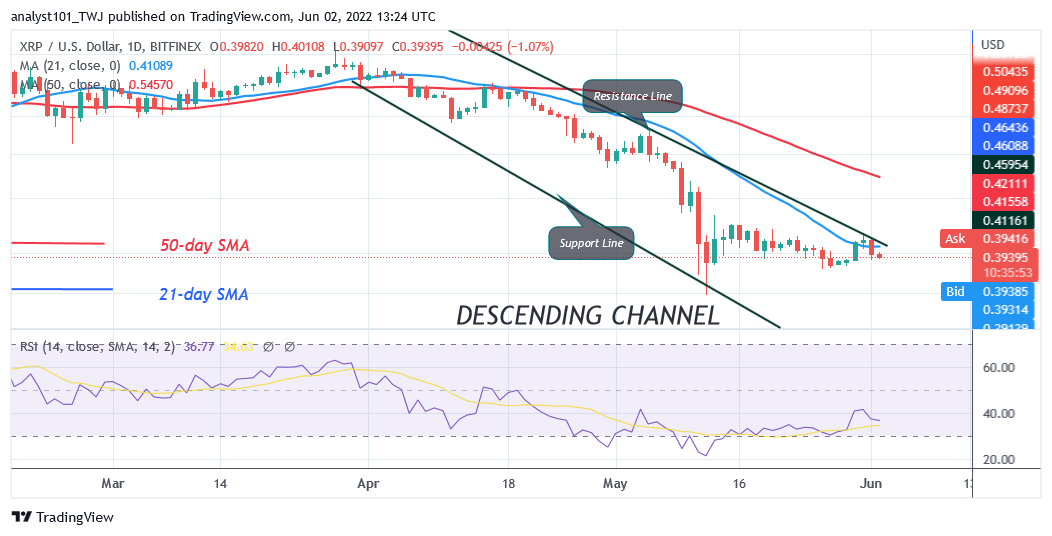
Ripple’s (XRP) price is in a downward correction as it faces rejection at $0.42. XRP price breaks above the 21-day line SMA and then pulls back. The cryptocurrency is making a downward move to reach the previous low of $0.37. The coin will further decline to the $0.33 low if the bears break below the $0.37 support. On the upside, the upward move has been restricted by the 21-day line SMA. Nevertheless, if the $0.37 support holds, the XRP price may rebound. The resulting bullish momentum will break the 21-day line SMA and rally to the 50-day line SMA.
Ripple (XRP) Indicator Analysis
Ripple is at level 36 of the Relative Strength Index for period 14. XRP is still in the downtrend zone as it consolidates above the $0.40 support. The crypto’s price is below the moving averages indicating a further downward movement of the cryptocurrency. XRP is below the 40% range of the daily stochastic. The market is in a bearish momentum.
Technical indicators:
Major Resistance Levels – $2.00, $2.50, $3.00
Major Support Levels – $1.50, $1.00, $0.50
What Is the Next Direction for Ripple (XRP)?
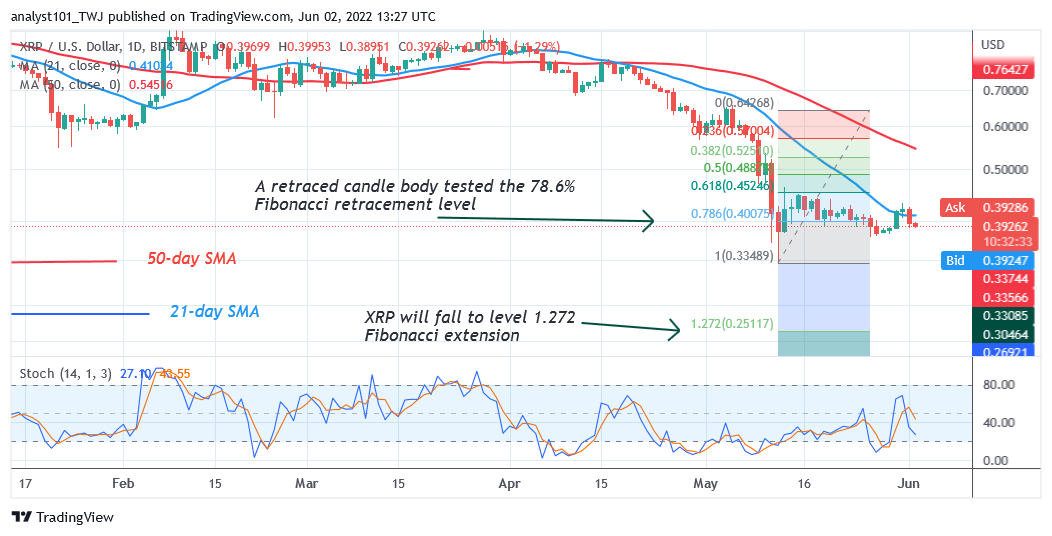
Ripple is in a downward move as it faces rejection at $0.42. The current downtrend may revisit the previous low at $0.33. Meanwhile, on May 12 downtrend; a retraced candle body tested the 78.6% Fibonacci retracement level. The retracement indicates that XRP will fall to level 1.272 Fibonacci extension or $0.25.
You can purchase crypto coins here. Buy LBlock
Note: Cryptosignals.org is not a financial advisor. Do your research before investing your funds in any financial asset or presented product or event. We are not responsible for your investing results