Ripple Resumes Sideways Move as It Holds Above $0.30
Estimated Reading Time: 3 minutes
Don’t invest unless you’re prepared to lose all the money you invest. This is a high-risk investment and you are unlikely to be protected if something goes wrong. Take 2 minutes to learn more

Free Crypto Signals Channel
Ripple (XRP) Long-Term Analysis: Bearish
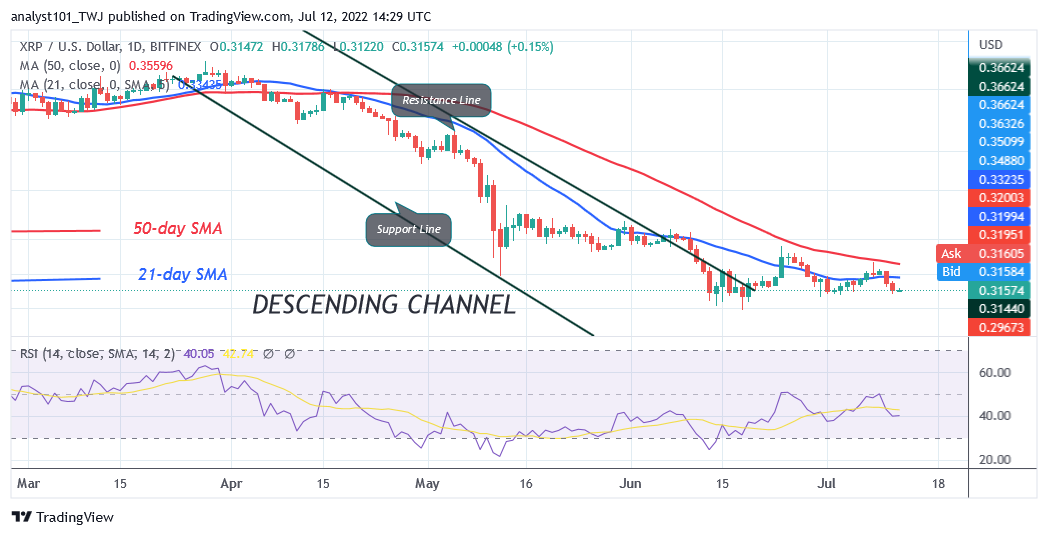
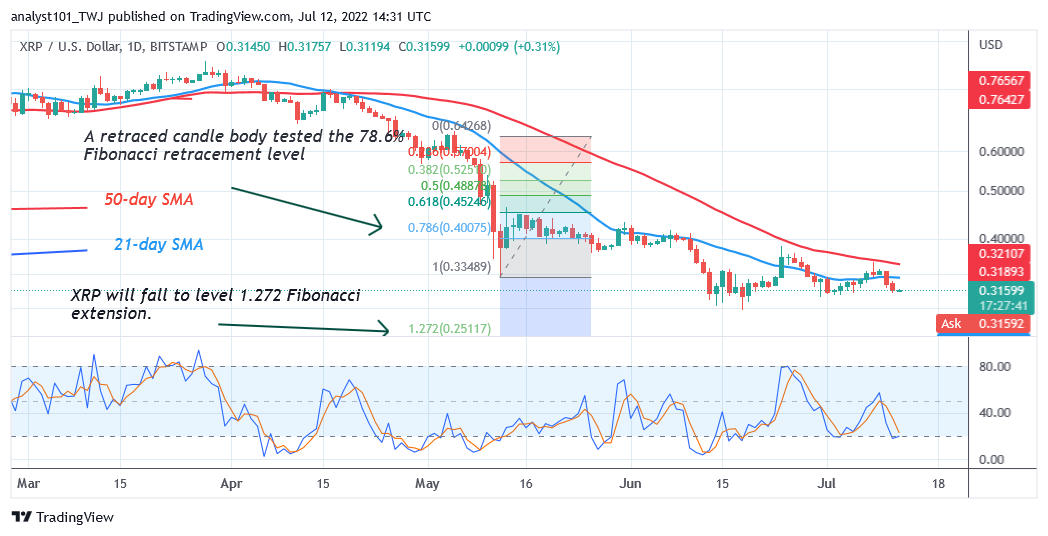
Ripple’s (XRP) price is in a downtrend as it holds above $0.30. XRP declines to the low of $0.30. Further upward moves are doubtful as the cryptocurrency faces rejection at the 21-day line SMA. For instance, the 21-day line SMA has restrained a further upward movement of XRP since May 12. Meanwhile, if the current support at $0.30 holds, the cryptocurrency will be compelled to a range-bound move between $0.30 and $0.52 price levels. Nevertheless, XRP will further decline to the low of $0.25 if the current support is breached. In the meantime, the price action is characterized by small body indecisive candlesticks called Doji. Doji candlesticks indicate that buyers and sellers are undecided about the direction of the market.
Ripple (XRP) Indicator Analysis
The altcoin has fallen to level 39 of the Relative Strength Index for period 14. XRP is in the downtrend zone and may further decline. The crypto’s price bars are below the moving average lines which accelerates the downward move. XRP is below the 20% range of the daily stochastic. The crypto has fallen to the oversold region of the market. The 21-day line SMA and the 50-day line SMA are sloping southward depicting the downtrend.
Technical indicators:
Major Resistance Levels – $2.00, $2.50, $3.00
Major upport Levels – $1.50, $1.00, $0.50
What Is the Next Direction for Ripple (XRP)?
Ripple is in a downward movement as it holds above $0.30 . XRP risks further decline if the current support is breached. Meanwhile, on May 12 downtrend; a retraced candle body tested the 78.6% Fibonacci retracement level. The retracement suggests that XRP will fall to level 1.272 Fibonacci extension or level $0.25.
You can purchase crypto coins here. Buy LBlock
Note: Cryptosignals.org is not a financial advisor. Do your research before investing your funds in any financial asset or presented product or event. We are not responsible for your investing results