Ripple (XRP) Breaks $0.92 Support, Resumes Downtrend
Estimated Reading Time: 2 minutes
Don’t invest unless you’re prepared to lose all the money you invest. This is a high-risk investment and you are unlikely to be protected if something goes wrong. Take 2 minutes to learn more

Ripple (XRP) Long-Term Analysis: Bearish
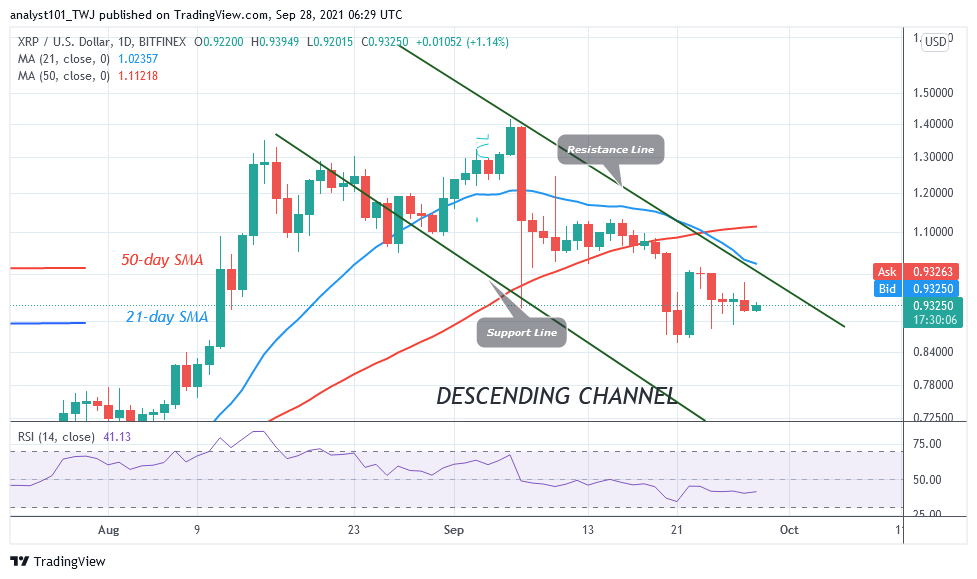
Today, Ripple’s (XRP) price declines to $0.90 low after breaking below the previous low. On September 21, the XRP price breaks below $0.92 but corrected upward to $1.00 high. The upward correction was repelled. Today, the downtrend is likely to continue as price breaks below the previous low at $0.92, the second time. The downtrend is likely to extend to the low of $0.62.
Ripple (XRP) Indicator Analysis
Ripple is at level 38 of the Relative Strength Index period 14. It indicates that the market is in the downtrend zone and below the centerline 50. The crypto is capable of falling on the downside.XRP is below the 25% range of the daily stochastic. The altcoin is in a bearish momentum. The altcoin is also approaching the oversold region. Ripple has a bearish crossover as the 21-day SMA crosses below the 50-day SMA. This indicates a sell signal.
Technical indicators:
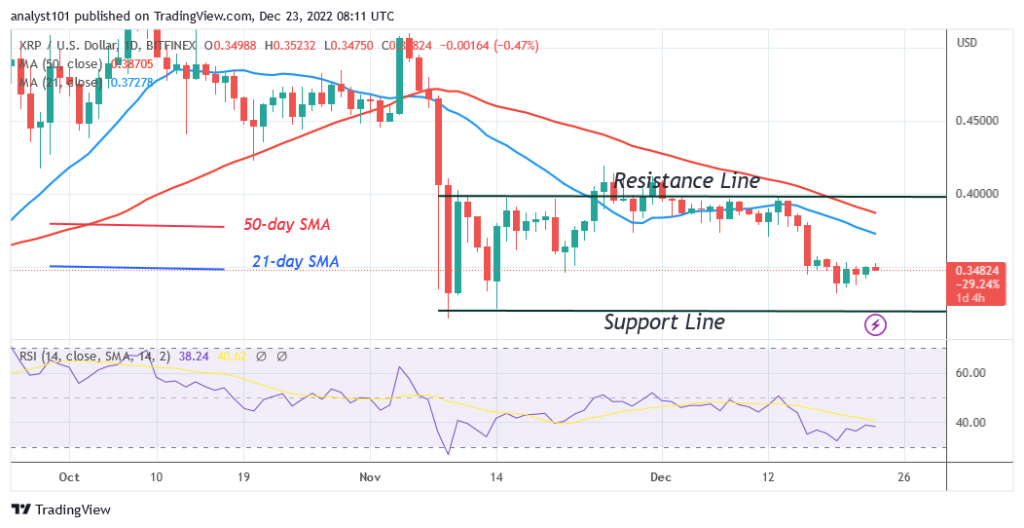
Major Resistance Levels – $2.00, $2.50, $3.00
Major Support Levels – $1.50, $1.00, $0.50
What Is the Next Direction for Ripple (XRP)
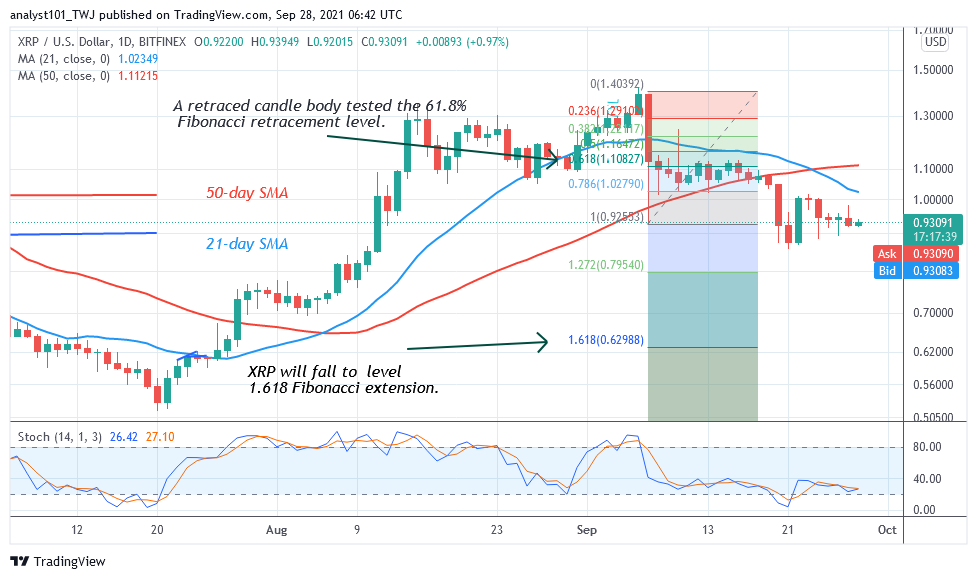
Ripple is in a downward move. The Fibonacci tool analysis is likely to be held as the selling pressure resumes. Meanwhile, on September 7 downtrend; a retraced candle body tested the 61.8% Fibonacci retracement level. The retracement indicates that XRP price will fall to the low of level 1.618 Fibonacci extension or level $0.62. From the price action, the market has declined to the low of $0.90.
You can purchase crypto coins here. Buy Tokens
Note: Cryptosignals.org is not a financial advisor. Do your research before investing your funds in any financial asset or presented product or event. We are not responsible for your investing results