Ripple (XRP) Declines as Bears Resume Selling Pressure below $0.68
Estimated Reading Time: 2 minutes
Don’t invest unless you’re prepared to lose all the money you invest. This is a high-risk investment and you are unlikely to be protected if something goes wrong. Take 2 minutes to learn more
![]()
Ripple (XRP) Long-Term Analysis: Bullish
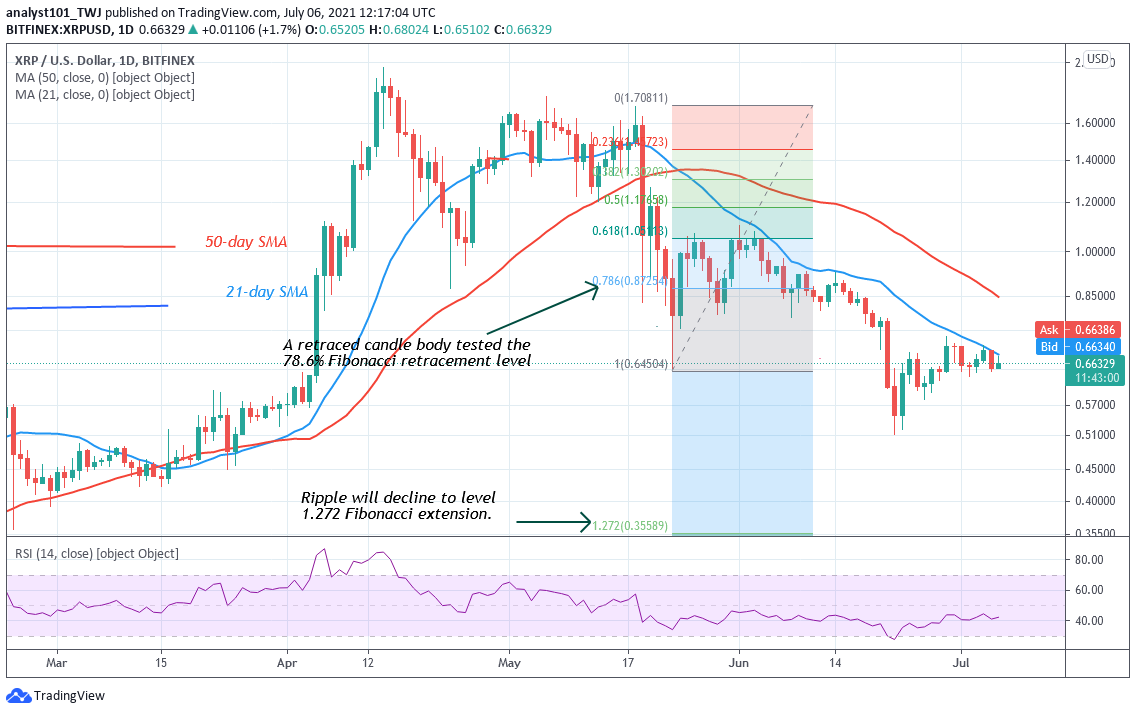
On June 22, Ripple plunged to $0.51 low as bulls bought the dips. The bears succeeded in breaking the previous low of $0.65 but buyers push price upward. The upward move is facing resistance at the high of $0.68. The market will encounter accelerated price movement if the initial resistance at $0.68 is breached. XRP will rise to retest the $1.10 high. Conversely, if the bulls fail to break above the recent high, the selling pressure will resume. Meanwhile, on May 23 downtrend; a retraced candle body tested the 78.6 % Fibonacci retracement level. The retracement indicates that Ripple will further decline to level 1.272 Fibonacci extension or level $0.35. From the price action, XRP is retracing.
Ripple (XRP) Indicator Analysis
Ripple is at level 42 of the Relative Strength Index period 14. Ripple is still in the downtrend zone and below the centerline 50. The crypto is above the 25% range of the daily stochastic. The market is in bullish momentum. The 21-day and the 50-day SMAs are sloping downward indicating the downtrend. The 21-day SMA is acting as a resistance to price bullish movement.

Technical indicators:
Major Resistance Levels – $2.00, $2.50, $3.00
Major Support Levels – $1.50, $1.00, $0.50
What Is the Next Direction for Ripple (XRP)
Ripple upward move faces rejection at the recent high of $0.68 as price resumes downward move. XRP is likely to further decline on the downside. Meanwhile, on June 30 downtrend; a retraced candle body tested the 50% Fibonacci retracement level. The retracement indicates that Ripple is likely to fall to level 2.0 Fibonacci extension or level $0.59.

You can purchase crypto coins here. Buy Tokens
Note: new.cryptosignals.org is not a financial advisor. Do your research before investing your funds in any financial asset or presented product or event. We are not responsible for your investing results

