Ripple (XRP) Slumps to $1.22 Low, Faces another Rejection at a Level of $1.50
Estimated Reading Time: 2 minutes
Don’t invest unless you’re prepared to lose all the money you invest. This is a high-risk investment and you are unlikely to be protected if something goes wrong. Take 2 minutes to learn more
![]()
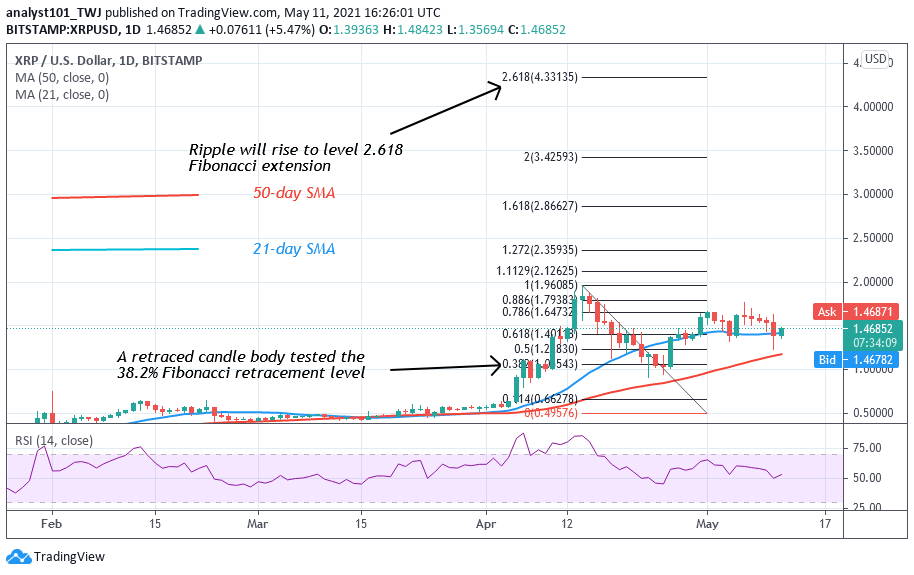
Ripple (XRP) Long-Term Analysis: Bullish
Yesterday, Ripple fell from the high of level $1.76 to a low of $1.22. Today, the coin has resumed upward as it found support above the 21-day SMA. The bulls bought the dips and compelled XRP to resume an upward move. . Meanwhile, on April 14 uptrend; a retraced candle body tested the 38.2% Fibonacci retracement level. The retracement implies that Ripple is likely to rise to level 2.618 Fibonacci extension or the high of $4.33.
Ripple (XRP) Indicator Analysis
XRP/USD is at level 52 of the Relative Strength index period 14. It indicates that XRP is in the uptrend zone above the centerline 50. XRP price is above the 21-day and the 50-day SMA which suggests an upward movement of the coin. Presently a bullish candlestick is above the 21-day SMA support.
Technical indicators:
Major Resistance Levels – $2.00, $2.50, $3.00
Major Support Levels – $1.50, $1.00, $0.50
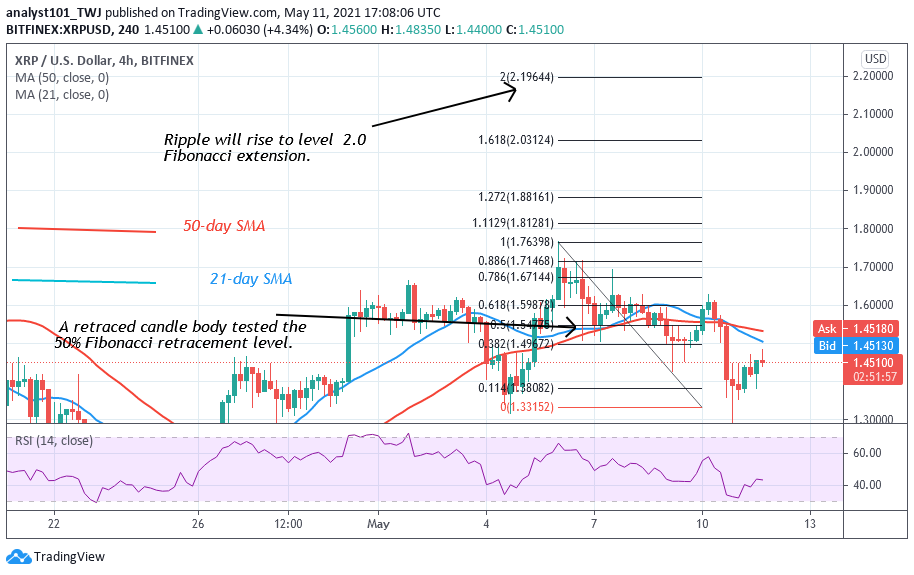
What Is the Next Direction for Ripple (XRP)?
Ripple has resumed an upward move after a recent retracement. On May 6 uptrend; a retraced candle body tested the 50% Fibonacci retracement level. The retracement indicates that the market will rise to level 2.0 Fibonacci extension or the high a level.
Note: cryptosignals.org is not a financial advisor. Do your research before investing your funds in any financial asset or presented product or event. We are not responsible for your investing results