Ethereum (ETH/USD) Trade Keeps Above $4,000
Estimated Reading Time: 3 minutes
Don’t invest unless you’re prepared to lose all the money you invest. This is a high-risk investment and you are unlikely to be protected if something goes wrong. Take 2 minutes to learn more
Ethereum Price Prediction – November 1
It observed that the ETH/USD trade operation keeps above the trading line at $4,000 over a couple of sessions. The crypto-economic price, as of writing, trades around $4,351 at a positive percentage rate of 1.40. It means that the market still pushes for northward points until now.
ETH/USD Market
Key Levels:
Resistance levels: $4,500, $4,750, $5,000
Support levels: $3,750, $3,500, $3,250
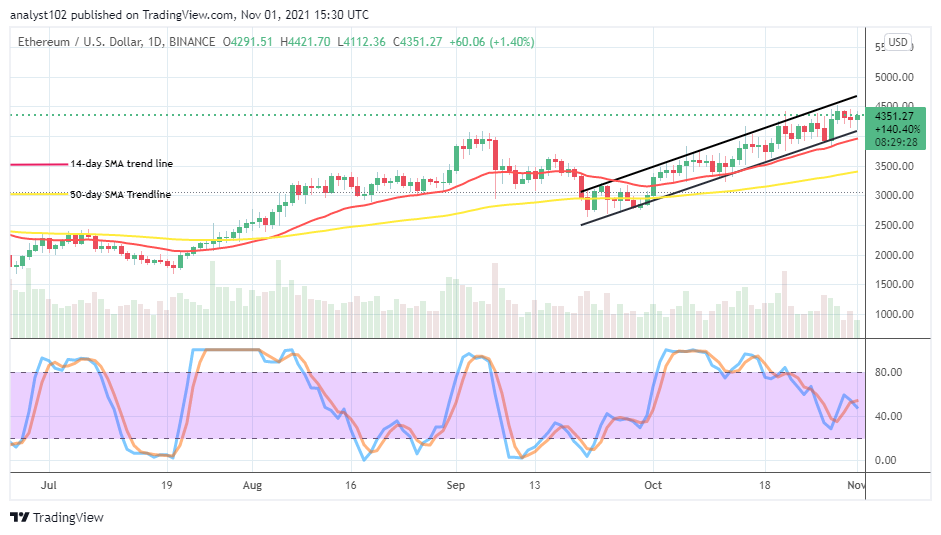
ETH/USD – Daily Chart
The ETH/USD daily chart showcases that the crypto trade keeps above the $4,000 as the bullish channel trend lines drew to clarify the paths to the moon side. The lower bullish channel trend line drew closer to the smaller SMA trend line. The 50-day SMA indicator is underneath the 14-day SMA indicator. The Stochastic Oscillators are around the range of 40, seemingly trying for the second time to cross the lines southbound from a close top location. That signifies the possibility of seeing the market losing parts of its valuation to the downside.
Will the ETH/USD market succumb to resistance as the crypto-economic trade keeps above $4,000?
There is a likelihood that the ETH/USD market operations succumb to resistances at a higher trading zone as the trade keeps above the level of $4,000 in the near time. Bulls have been able to re-energize their appearances in the market while price tries to pass through a correction motion at the value line in the recent past. That value line has to breach violently to the south, to invalidate that assumption not playing out again in the subsequent sessions.
On the downside, the ETH/USD market bears have to watch out for an area of intense resistance-trading spot around $4,500 level to get decent a sell entry. A sudden hike against the point line may project the market to get another new higher all-time valuation. As it is presently, there has been no sign to back the possibility of that assumption playing out in the near sessions.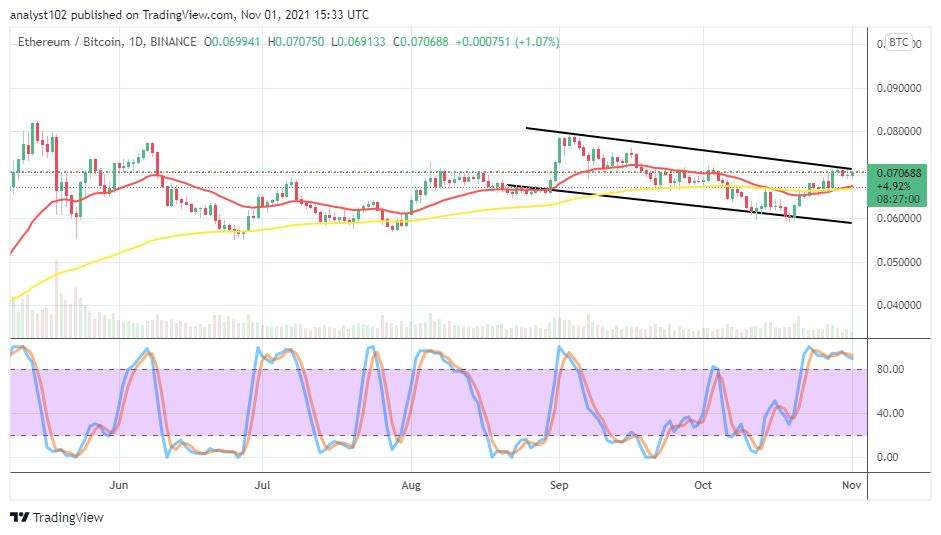
ETH/BTC Price Analysis
In comparison, Ethereum has been a bit stronger in the trending capacity as paired with Bitcoin for a while. The cryptocurrency pair trade keeps above the SMAs at a closer spot. The 14-day SMA trend line has crossed northward, joining the 50-day SMA trend line from beneath. The Stochastic Oscillators are in the overbought region, with the lines conjoined to signify a consolidation moving manner. That indicates that the cryptocurrency pair trade is getting set to re-shape its moving status. It seems that the base crypto may go for downs, trending with the flagship counter trading instrument for a while in the following sessions.
Note: Cryptosignals.org is not a financial advisor. Do your research before investing your funds in any financial asset or presented product or event. We are not responsible for your investing results.
You can purchase crypto coins here. Buy Tokens