UMAUSD Might Reverse at Major Support Zone
Estimated Reading Time: 2 minutes
Don’t invest unless you’re prepared to lose all the money you invest. This is a high-risk investment and you are unlikely to be protected if something goes wrong. Take 2 minutes to learn more
UMAUSD Market Analysis – The Price Might Reverse After Reaching a Major Support Zone
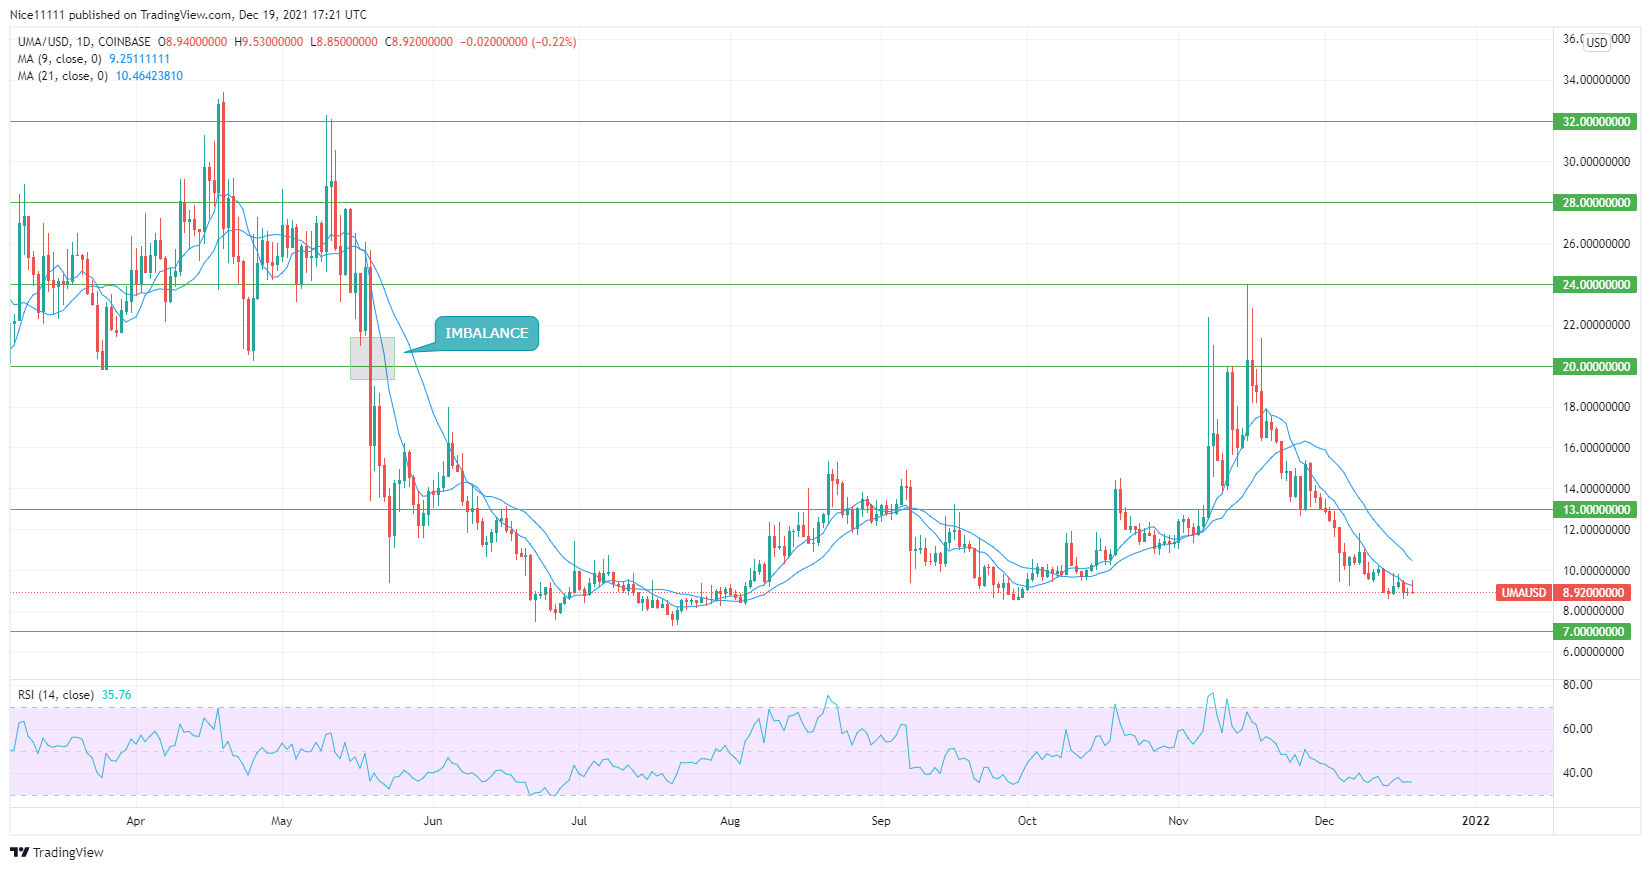
UMAUSD might reverse upon reaching a major support zone. The market has been ruled by the sellers since the price hit $32 in April. The 9 Moving Average and the 21 Moving Average crossed to show the market was ready for a bearish run. The buyers tried to defend the zone at $20 and managed to pump the price back up to $32. The bears sold aggressively again, violating all support zones at $20 and $24. This created the imbalance seen on the daily chart in May.
UMAUSD Key Zones
Support Zone: $7, $20, $24
Resistance Zone: $20, $32, $38
The major support zone at $20 eventually became a major resistance zone. The imbalance in the market was filled up eventually. The bulls pushed the price to $20 and even slightly above the imbalance at $24. The momentum of the buyers could not be maintained. The sellers show a clear sign that they were active with long wicks on daily candles in November. Once again, the market was sunk by the sellers in November.
On the daily chart, after the imbalance got filled up, the 9 and 21 Moving Averages crossed each other. This was a confirmation after multiple long wicks in November. Manipulation in the market occurred in the $13 zone to fake out those who wanted to go long. The market gave signs that UMAUSD might reverse. This is seen with a break in the market structure. The market has continued to crash towards a major support zone. The Relative Strength Index also shows the market’s overall bearishness, with the lines well below 50.

UMAUSD Market Anticipation
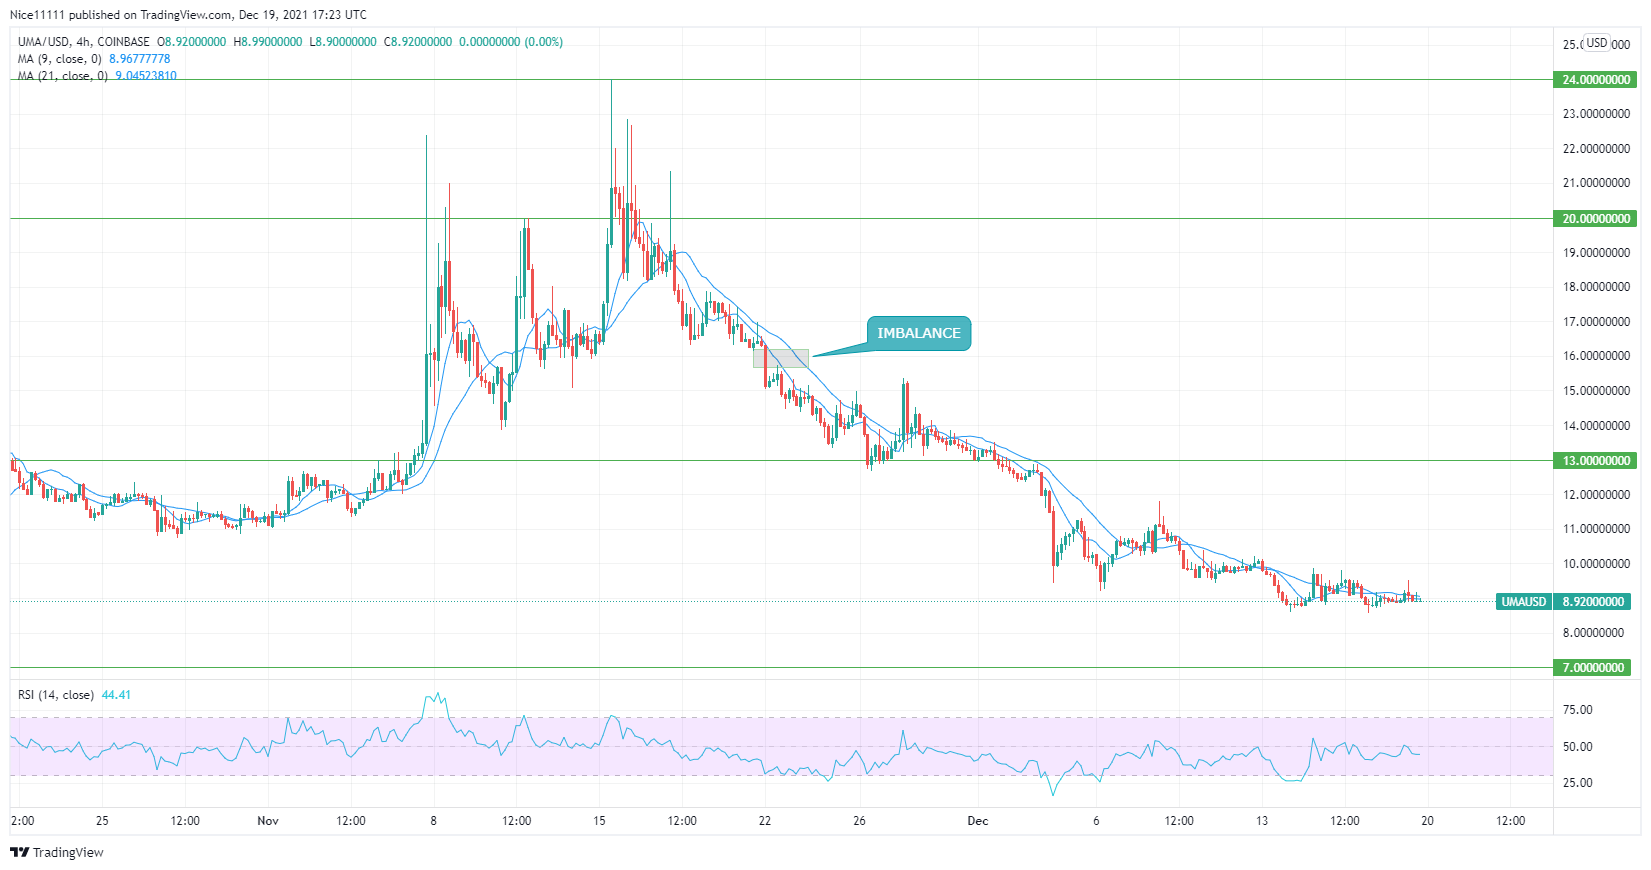
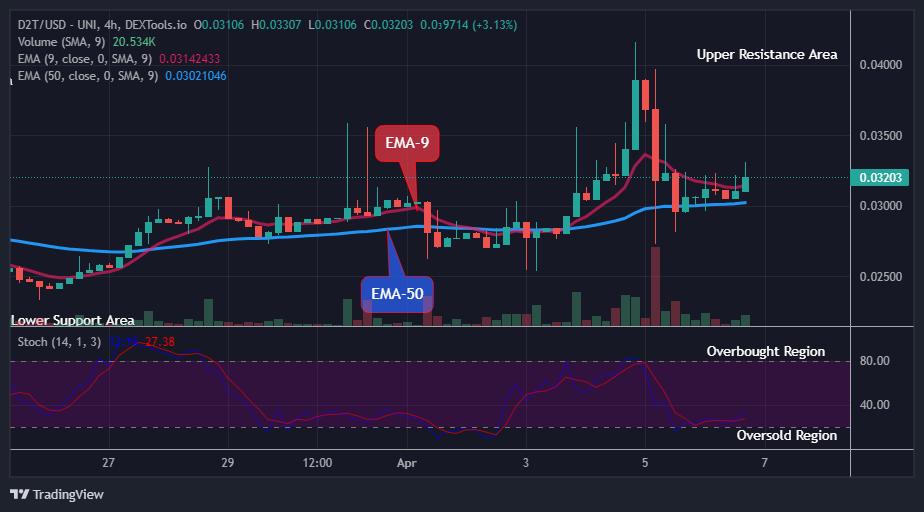
The market is likely to sink to $7, which is a major support zone. The 4-hour chart has left an imbalance which the market is likely to reach after hitting the key zone. UMAUSD might reverse to go after the gap. The 9 and 21 Moving Averages have crossed, showing likely signs of a reversal to reach up to $13.
You can purchase crypto coins here: Buy Tokens
Note: Cryptosignals.org is not a financial advisor. Do your research before investing your funds in any financial asset or presented product or event. We are not responsible for your investing results.