Ethereum (ETH/USD) Price Makes an Upward Move
Estimated Reading Time: 3 minutes
Don’t invest unless you’re prepared to lose all the money you invest. This is a high-risk investment and you are unlikely to be protected if something goes wrong. Take 2 minutes to learn more

Free Crypto Signals Channel
Ethereum Price Prediction – February 21
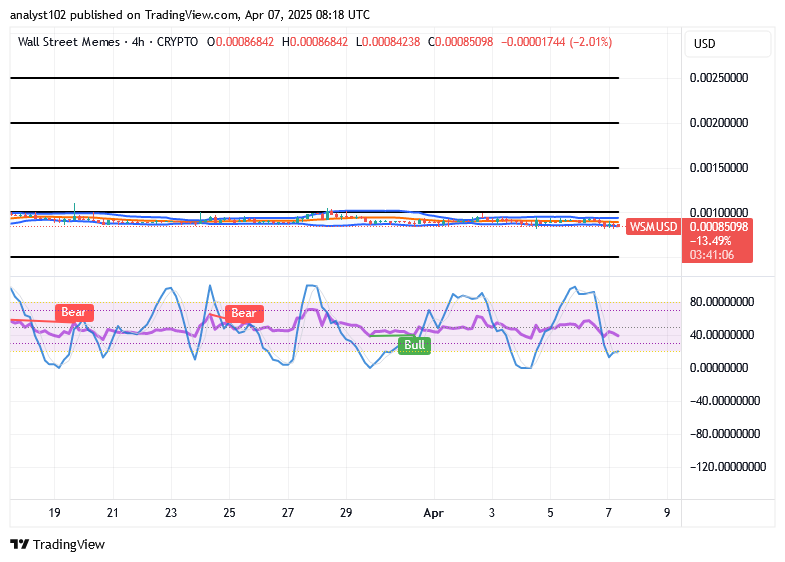
The ETH/USD price makes an upward move to signal against the present downing motion. The crypto’s price is trading between $2,756 and $2,606 at a positive percentage rate of 4.04. The motion capacity has been on lowly pace, making entries very dicey as of the writing.
ETH/USD Market
Key Levels:
Resistance levels: $3,000, $3,250, $3,500
Support levels: $2,500, $2,250, $2,000
.
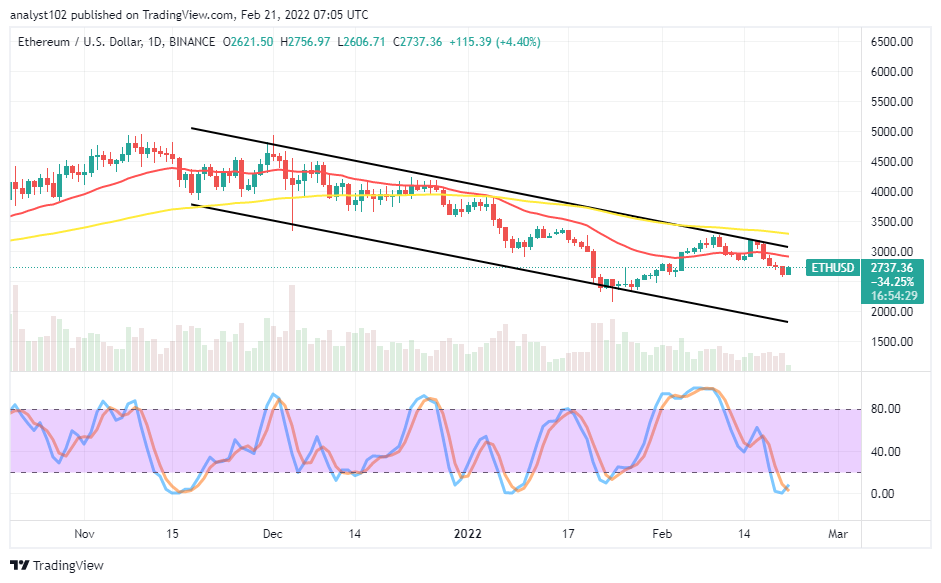
ETH/USD – Daily Chart
The ETH/USD daily chart reveals that the crypto-economic market price makes an upward move against its recent downward-moving manner. It observed that the move to the downside and the current upside lacks volatility. The 14-day SMA indicator is underneath the 50-day SMA indicator. The bearish channel trend lines southward to embody the trading situation. The Stochastic Oscillators are in the oversold region, attempting to cross northbound. That shows support for getting to see an upward-gathering momentum presently.
What could be the outcome of price consolidating in the oversold region concerning the current ETH/USD trade as price makes an upward move?
The outcome of price consolidating in the oversold region can potentially lead to a return of downward trend as the ETH/USD trade price makes an upward move on a lighter mode. In the bid to keep almost a perfect bearish path of the cycle, the market needed at this point to rally back upward to test a resistance spot around the upper bearish channel trend line for a sell order. In the meantime, the situation seems to satisfy buying pressures unwittingly.
On the downside of the technical analysis, the ETH/USD market short-position placers will have to suspend their selling orders for a while to let the market beef up to a higher resistance trading zone. The most reliable selling point entry of this crypto-economy still lies around or closely beneath the trend line of the 50-day SMA. Therefore, patience is the watchword to achieving that assumption afterward.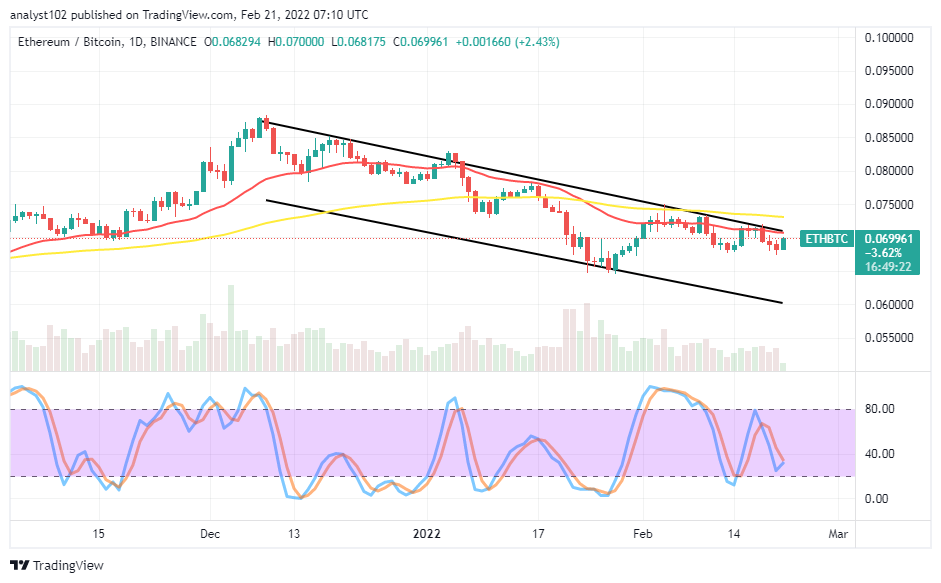
ETH/BTC Price Analysis
In comparison, Ethereum still falls under a bearish trading path as placed with Bitcoin. The cryptocurrency pair price makes an upward move by featuring a bullish candlestick presently close to the upper bearish trend line drawn, playing a backing resistance role to the smaller SMA. The 50-day SMA is above the 14-day SMA, showcasing that the crypto-pair operation is yet to push over falling conditions. The Stochastic Oscillators are in the ranges of 40 and 20, trying to cross the lines northbound. That denotes the base crypto is struggling to regain its lost momentums currently.
Note: Cryptosignals.org is not a financial advisor. Do your research before investing your funds in any financial asset or presented product or event. We are not responsible for your investing results.
You can purchase Lucky Block here. Buy LBlock: