Estimated Reading Time: 3 minutes
Don’t invest unless you’re prepared to lose all the money you invest. This is a high-risk investment and you are unlikely to be protected if something goes wrong. Take 2 minutes to learn more

Bitcoin (BTC/USD) surges amid momentum strength and structural bullish confirmation
Bitcoin Price Prediction – May 22
BTCUSD market surges amid momentum strength and structural bullish confirmation. The BTCUSD pair currently trades in a bullish environment supported by key indicators.
The 9-day Simple Moving Average (SMA) is sloping upward, currently around $104,850, serving as dynamic support. The Relative Strength Index (RSI) hovers around 70, indicating strong bullish momentum, though nearing overbought conditions. This RSI level confirms sustained buying pressure, often associated with upward price continuations during trending markets.
BTC/USD Market Key Levels:
Resistance Levels: $108,390, $115,000, $125,000
Support Levels: $95,980, $85,010, $74,420
https://www.tradingview.com/x/FsfSJ2kJ/
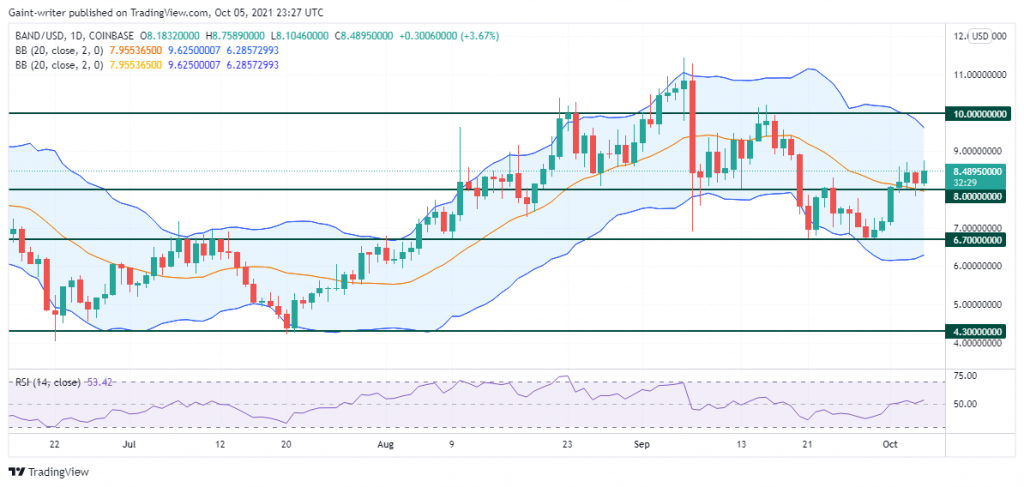
BTC/USD – Daily Chart
The BTCUSD daily chart shows a continuous rally to the upside as the all -time high gets broken.
BTCUSD has established a clear change of character (CHoCH) in April, where prior resistance near $95,980 was broken and retested. Since that shift, the pair has maintained a structure of higher highs and higher lows. Price has recently printed a local high near $108,390 and is consolidating just above minor support around $106,530. This retracement appears healthy within an overall bullish impulse, with no signs of structural breakdown on the daily timeframe.
What is the likely projection of BTCUSD?
Looking ahead, the bullish trajectory positions BTCUSD for a potential advance toward the $115,000 resistance level. Should this level be breached with strong volume, the next institutional target lies at $125,000. However, short-term retracements to $102,110 or the SMA zone around $104,850 may occur before a continuation, offering potential re-entry zones for trend-aligned participants. Unless a breakdown below $95,980 occurs, the macro bullish bias remains intact.
BTC/USD – Four-Hour Chart
https://www.tradingview.com/x/lSsvquUS/
BTCUSD remains bullish on the 4-hour chart, respecting an ascending trendline and trading above the 9-period SMA at approximately $106,150. Price action is consolidating below a key resistance level at $108,390, suggesting a potential breakout if momentum builds.
The RSI at 58.97 indicates moderate bullish strength, leaving room for further upside before overbought conditions set in. If a short-term dip occurs, support near $104,770 or $100,700 could provide a springboard for the next leg upward.
Bitcoin (BTC) Current Statistics
The current price: $106,530
Market Capitalization: $2,200,000,000,000
Trading Volume: $62,050,000,000
Bitcoin Price Prediction – May 22
BTCUSD market surges amid momentum strength and structural bullish confirmation. The BTCUSD pair currently trades in a bullish environment supported by key indicators.
The 9-day Simple Moving Average (SMA) is sloping upward, currently around $104,850, serving as dynamic support. The Relative Strength Index (RSI) hovers around 70, indicating strong bullish momentum, though nearing overbought conditions. This RSI level confirms sustained buying pressure, often associated with upward price continuations during trending markets.
BTC/USD Market Key Levels:
Resistance Levels: $108,390, $115,000, $125,000
Support Levels: $95,980, $85,010, $74,420
https://www.tradingview.com/x/FsfSJ2kJ/
BTC/USD – Daily Chart
The BTCUSD daily chart shows a continuous rally to the upside as the all -time high gets broken.
BTCUSD has established a clear change of character (CHoCH) in April, where prior resistance near $95,980 was broken and retested. Since that shift, the pair has maintained a structure of higher highs and higher lows. Price has recently printed a local high near $108,390 and is consolidating just above minor support around $106,530. This retracement appears healthy within an overall bullish impulse, with no signs of structural breakdown on the daily timeframe.
What is the likely projection of BTCUSD?
Looking ahead, the bullish trajectory positions BTCUSD for a potential advance toward the $115,000 resistance level. Should this level be breached with strong volume, the next institutional target lies at $125,000. However, short-term retracements to $102,110 or the SMA zone around $104,850 may occur before a continuation, offering potential re-entry zones for trend-aligned participants. Unless a breakdown below $95,980 occurs, the macro bullish bias remains intact.
BTC/USD – Four-Hour Chart
https://www.tradingview.com/x/lSsvquUS/
BTCUSD remains bullish on the 4-hour chart, respecting an ascending trendline and trading above the 9-period SMA at approximately $106,150. Price action is consolidating below a key resistance level at $108,390, suggesting a potential breakout if momentum builds.
The RSI at 58.97 indicates moderate bullish strength, leaving room for further upside before overbought conditions set in. If a short-term dip occurs, support near $104,770 or $100,700 could provide a springboard for the next leg upward.
Bitcoin (BTC) Current Statistics
The current price: $106,530
Market Capitalization: $2,200,000,000,000
Trading Volume: $62,050,000,000