SNX (SNXUSD) Market Declines Further After Hitting the Resistance Level
Estimated Reading Time: 2 minutes
Don’t invest unless you’re prepared to lose all the money you invest. This is a high-risk investment and you are unlikely to be protected if something goes wrong. Take 2 minutes to learn more


Free Crypto Signals Channel
SNXUSD Analysis – Market Declines Further After Hitting the Resistance Level at $4.50
SNXUSD market declines further after hitting the resistance level at $4.50. Until the current shift in market structure, the market was in an uptrend environment, which began after a fake-out on the support at $2.50 in June 2022. Before the shift in market structure in June, the market began a new impulsive wave to the downside on the 1st of April, 2022.
SNXUSD Major Levels
Resistance levels: $4.50, $8.20
Support levels: $2.50, $0.40
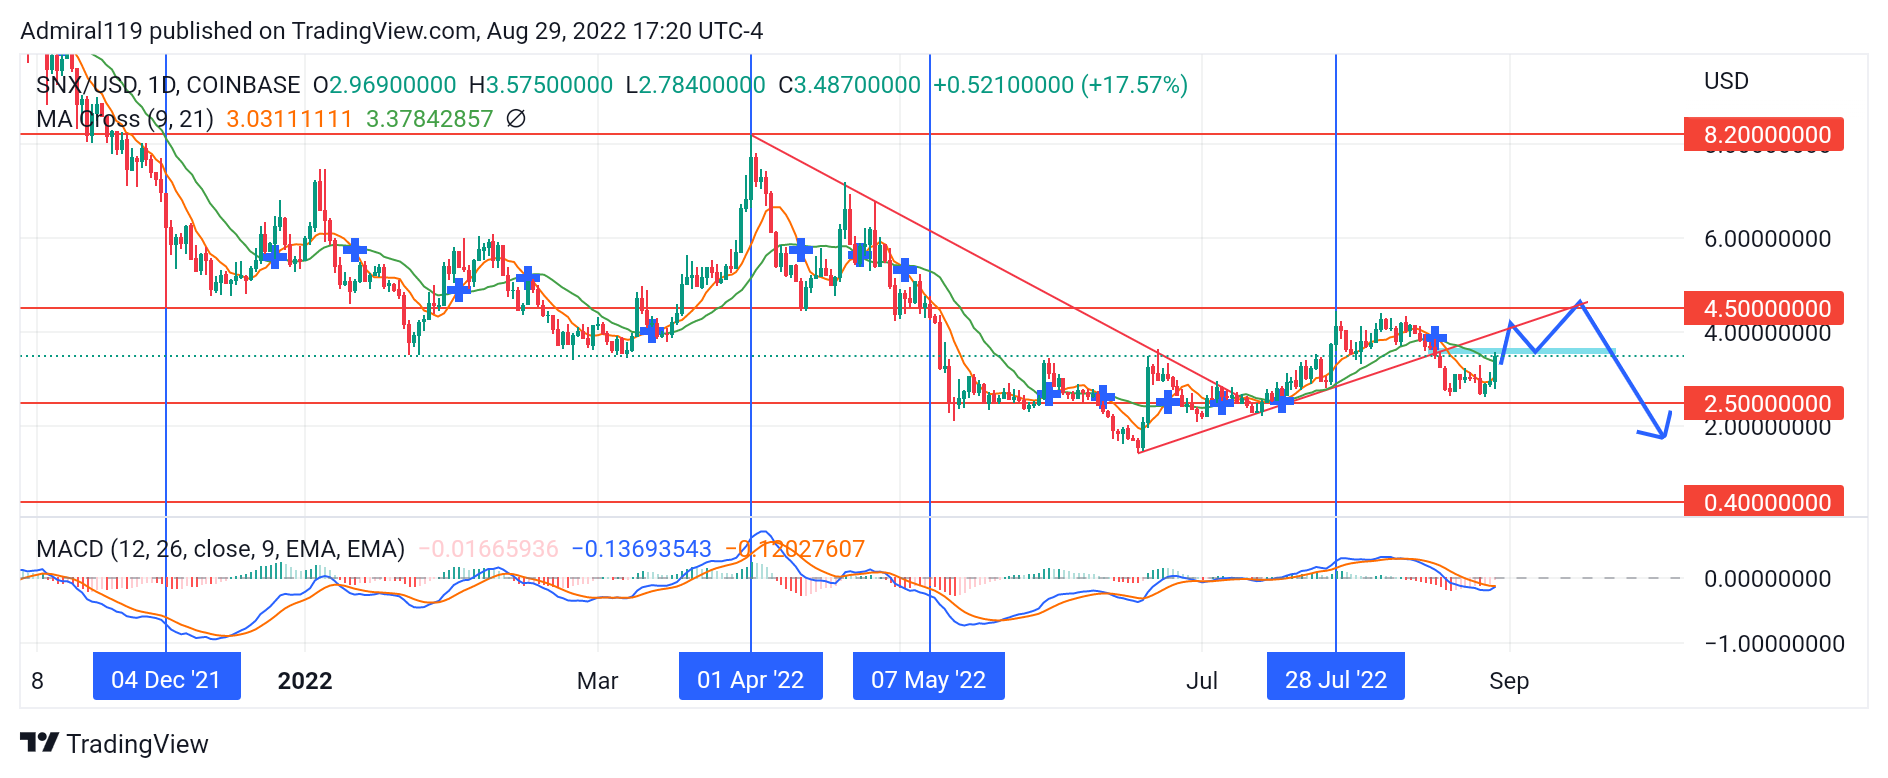
With respect to the daily time frame, the overall market trend has been bearish. On the 4th of December, 2022, the previous support level rejected the downward movement as the market rallied upward and struggled to break across the significant level. The struggle between the buyers and the sellers to take full control of the market ended when the bulls purged the price up towards the resistance level at $8.20.
Beginning on the 1st of April, 2022, the market kept on respecting the daily trendline downward. The MA Cross and MACD indicators confirmed the market’s structural shift as price broke out of the downward trendline to the upside. The market structure shifted to the downside after the market hit the resistance level at $4.50. The shift in the market structure led SNXUSD to break out from the upward trendline.
Market Expectation
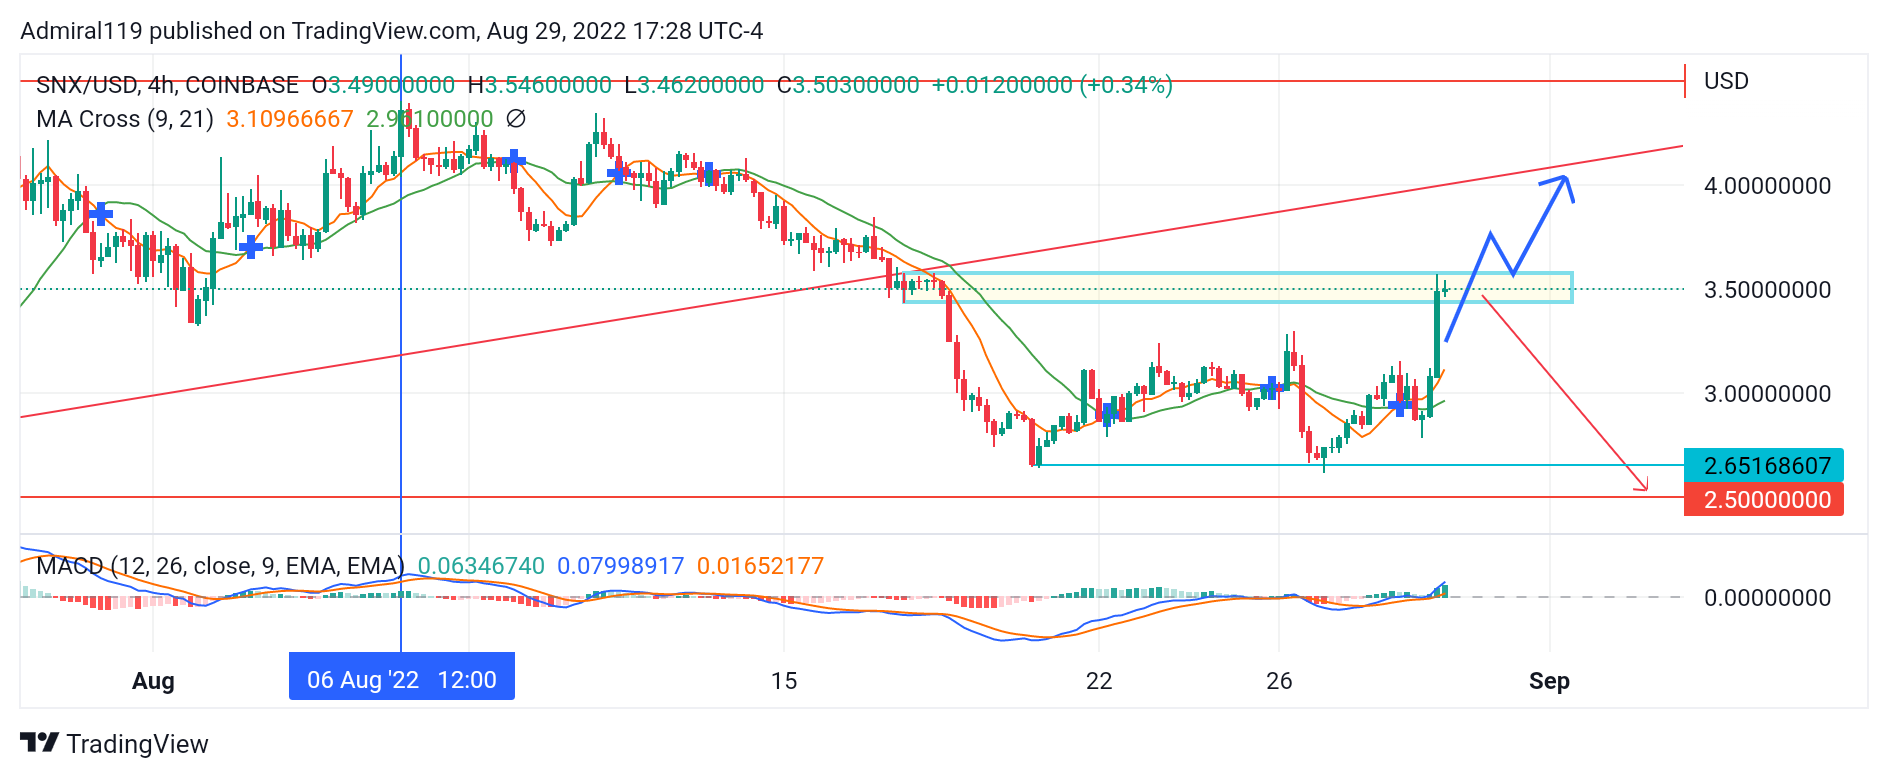
The market downtrend began on August 6, 2022, when the price reached the resistance level of $4.50 in the four-hour time frame. When SNXUSD broke out of the daily upward trendline, the market consolidated under a fair value gap as the bearish factor. The consolidation area is expected to either reject the price downward or retrace the price for an upward movement.
You can purchase Lucky Block here. Buy LBLOCK
Note: Cryptosignals.org is not a financial advisor. Do your research before investing your funds in any financial asset or presented product or event. We are not responsible for your investing results.