Solana (SOL) Price Prediction: SOL/USDT Bulls Stop to Catch Their Breath
Estimated Reading Time: 3 minutes
Don’t invest unless you’re prepared to lose all the money you invest. This is a high-risk investment and you are unlikely to be protected if something goes wrong. Take 2 minutes to learn more

Solana (SOL) Price Prediction: April 18, 2025
Solana (SOL) had previously fallen well below the $130 mark. However, the market soon began gaining bullish momentum, staging a comeback and now trading above the $130 price level. Let’s continue below for a more detailed price analysis.
SOL/USDT Long-Term Trend: Bullish (Daily Chart)
Key Price Levels:
Resistance: $140.00, $145.00, $150.00
Support: $130.00, $125.00, $120.00
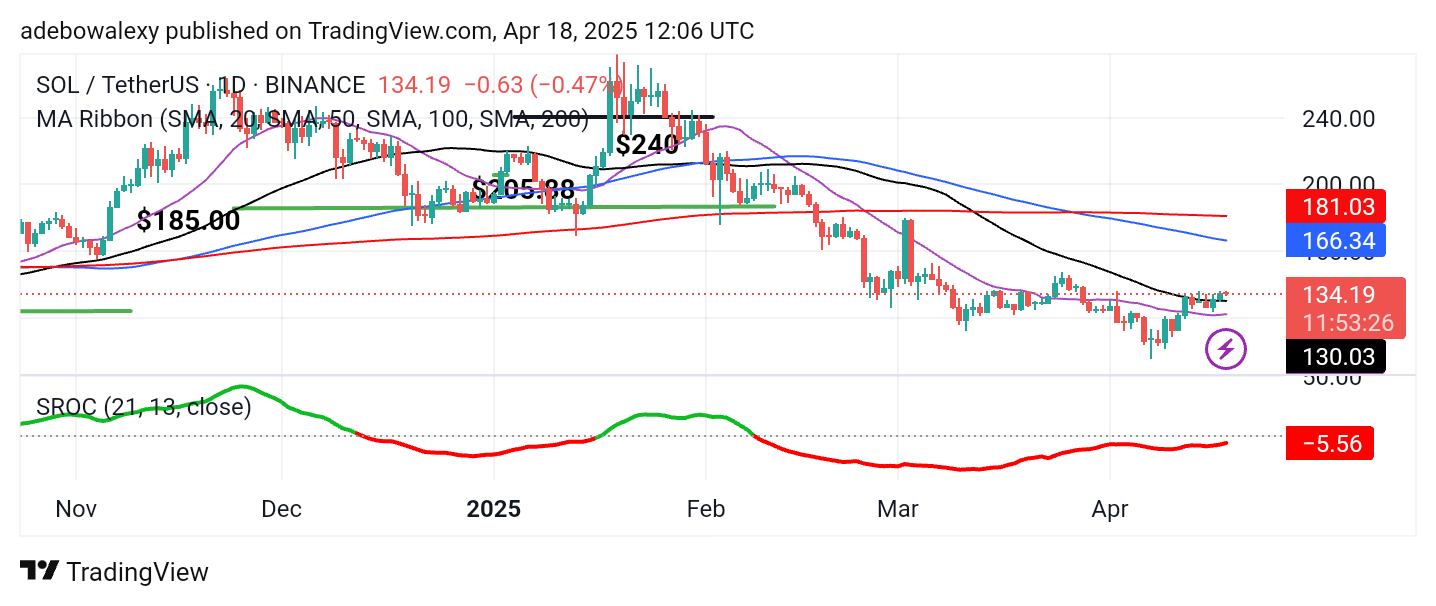
Price activity in the Solana daily market has resurfaced above the 20- and 50-day Moving Average (MA) lines. The price candle from the previous session is seen sitting directly on the 50-day MA curve. As a result, the latest price candle is floating just above the 50-day MA, despite its red appearance. Furthermore, the Stochastic Rate of Change (SROC) lines remain below the equilibrium level but maintain an upward trajectory toward it.
Solana (SOL) Price Prediction: SOL/USDT Upside Retracement May Extend
The Solana market has seen an impressive recovery over the past few weeks, with prices rising above the 20- and 50-day MA curves. The ongoing session has formed a small bearish candle but remains above the 50-day MA curve. Technically, this suggests that upside forces still have a good chance of advancing price movement.
At the same time, the SROC indicator lines are pushing upward, reflecting the recent bullish trend. Although still below the equilibrium level, the SROC line is on an upward path and is closing in on breaching the 0.00 mark. This implies that technical indicators are aligned in support of a continued bullish trend.
Solana (SOL) Price Prediction: SOL/USDT Holds Above Promising Price Levels
On the 4-hour chart, Solana price action continues to hold above all the MA lines. However, due to a pause in upward momentum, the market appears to be moving sideways. The most recent price candle resembles a dashed shape, revealing minimal price movement or volatility in the current session.
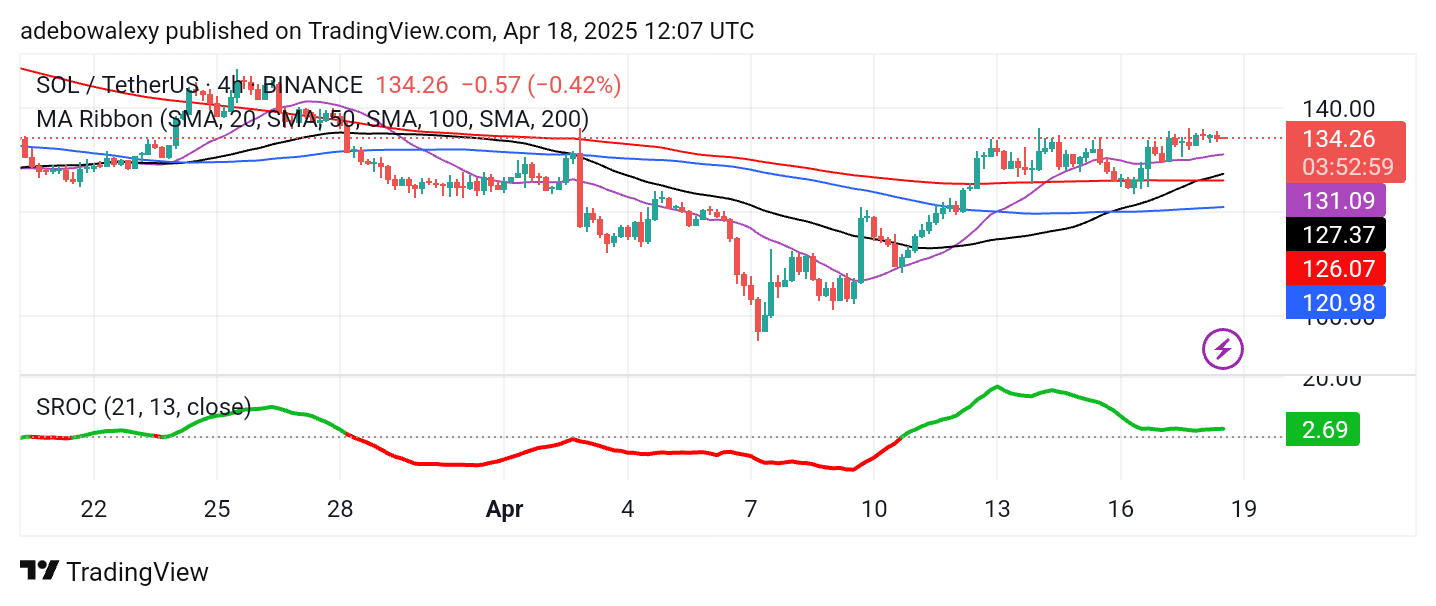
Meanwhile, the SROC indicator lines are positioned above the equilibrium level but are trending sideways, suggesting market consolidation. Even so, since price action maintains bullish positioning, traders may target the $140 price level for short-term gains.