Solana (SOL/USD) Market Downsizes in a Low-Active Manner
Estimated Reading Time: 3 minutes
Don’t invest unless you’re prepared to lose all the money you invest. This is a high-risk investment and you are unlikely to be protected if something goes wrong. Take 2 minutes to learn more

Free Crypto Signals Channel
Solana Price Prediction – August 18
Over time in the recent past-trading operations of the SOL/USD instrument, prices stretched in ranges northward. But the situation has made a turn as the crypto market downsizes in a low-active manner. With a minute degree of positivity, the price trades at an average of 0.44%, keeping a value around $40.72.
SOL/USD Market
Key Levels:
Resistance levels: $50, $60, $70
Support levels: $25, $20, $15
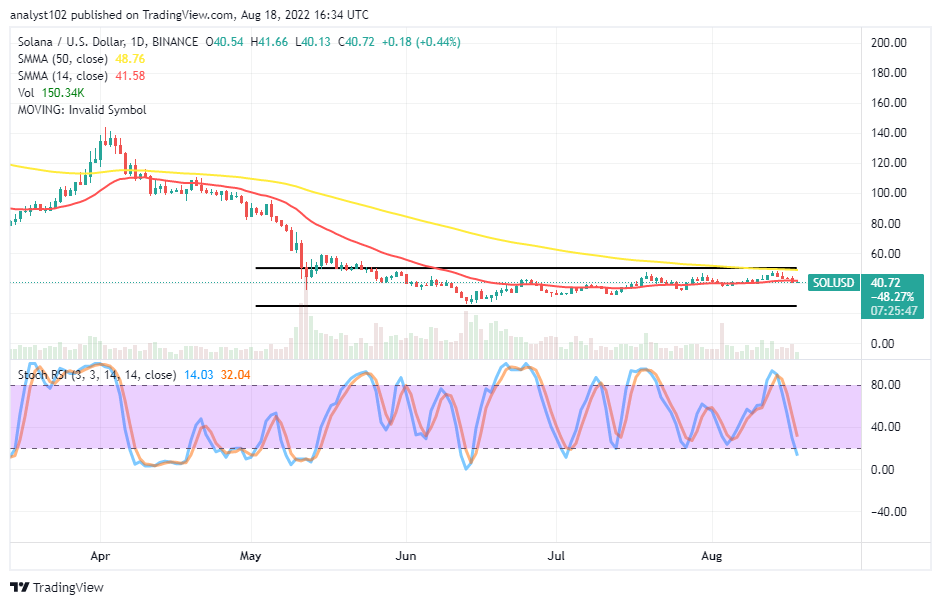
SOL/USD – Daily Chart
The daily chart showcases the crypto market downsizes in a low-active manner within the range-bound zones of $50 and $25. The 50-day SMA indicator is at 48.76 above the $41.58 value line of the 14-day SMA indicator, as the upper and the lower horizontal lines remain drawn at those points mentioned at the beginning of this analytics paragraph. The Stochastic Oscillators have crossed to 32.04 and 14.03 range values. And they are, still to some extent, pointing to the downside to denote that a falling pressure might not have been over.
Will the SOL/USD market lose momentum further past the 14-day SMA’s value line?
There might be a line of momentum losing in a slight method in the SOL/USD market operations around the trend line of the 14-day SMA as the crypto economy downsizes in a low-active manner. Long-position placers may have to exercise caution toward executing a buying order at the moment. A candlestick fully emerging in a bullish outlook at a particular time will potentially give a hedge into getting some ups.
On the downside of the technical analysis, the SOL/USD market bears may as usual not push southwardly past the trend line of the 14-day SMA to a lower-trading zone around the $25 range support level in the long run. The current outlook doesn’t portend a technically inclined myth to take to re-launching of selling orders as at the moment. Short-position placers may are enjoined to suspend their actions for a while.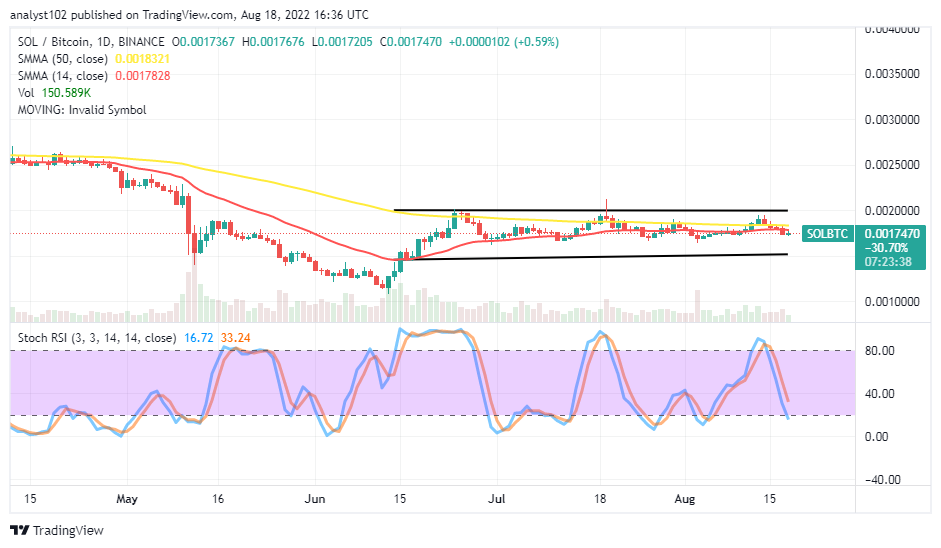 SOL/BTC Price Analysis
Solana market operation downsizes in a low-active manner against the trending force of Bitcoin in range-bound zones. The 14-day SMA indicator is tightly below the 50-day SMA indicator within the range-bound spots and they are pointing eastward to affirm that trading activities have been featuring in sideways mode. The Stochastic Oscillators have moved southbound to touch the ranges at 33.24 and 16.72. If a bullish candlestick eventually formed, the base crypto will tend to push back upward against the counter-trading crypto.
Note: Cryptosignals.org is not a financial advisor. Do your research before investing your funds in any financial asset or presented product or event. We are not responsible for your investing results.
You can purchase Lucky Block here. Buy LBLOCK