Solana (SOL/USD) Market Moons, Following the Consolidation of Bulls
Estimated Reading Time: 3 minutes
Don’t invest unless you’re prepared to lose all the money you invest. This is a high-risk investment and you are unlikely to be protected if something goes wrong. Take 2 minutes to learn more
Solana Price Prediction – July 14
An overbought condition has been observed formerly above the long-standing upper range zone in the SOL/USD trade as the crypto-economic market moons, following the consolidation of bulls.
The bullish trade cycle has been confirmed to be steadily materializing with a peek into the current gravitational pull. However, execution of longing orders should also be tampered with with caution as the present rising mood is ongoing and has the potential to give room to a reversal downtrend. Buyers’ baseline between $24 and $22 support shouldn’t be breached to uphold the current northward breakthroughs.
SOL/USD Market
Key Levels:.
Resistance levels: $32, $34, $36
Support levels: $24, $22, $20
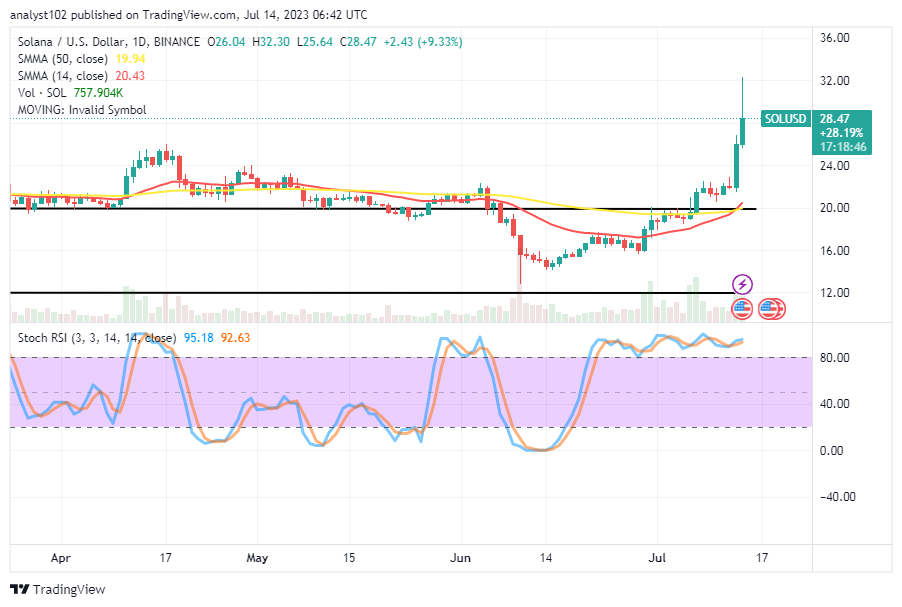
SOL/USD – Daily Chart
The SOL/USD daily chart showcases the crypto-economic market moons, following the consolidation of bulls far above the trend lines of the SMAs.
The 14-day SMA indicator has been pushing in the opposite direction against the 50-day SMA indicator to give points from $19.94 to $20.43. That shows pressure to the upside will prevail for some time over those values. The Stochastic Oscillators have been moving in a tight consolidation manner between the points of 92.63 and $95.18.
What kind of trading strategy is ideal for the SOL/USD market sellers in opposition to the existing, well-established increasing moments?
For about two days now, the SOL/USD market operations have been spiraling through variant imaginary resistances, following the consolidation of bulls out of a lower-range overbought condition in the recent session.
As the financial trade situation of the SOL/USD market is having it, buying volatility is ongoing between the paces of $2564 and $32.30 at a 9.33 percentage rate. Buyers should be wary of underlying supports, as once identified to be between $24 and $22, they are not to be retraced sustainably in the long, medium, or short terms.
On the downside of the technical analysis, let there be a strategic repositioning around resistances, marking between $30 and $32 in the near term. If today’s trading candlestick finishes with a top shadow coupling with a slight southbound cross from the overbought zone, this will lead to decent shorting orders, especially around those points already depicted.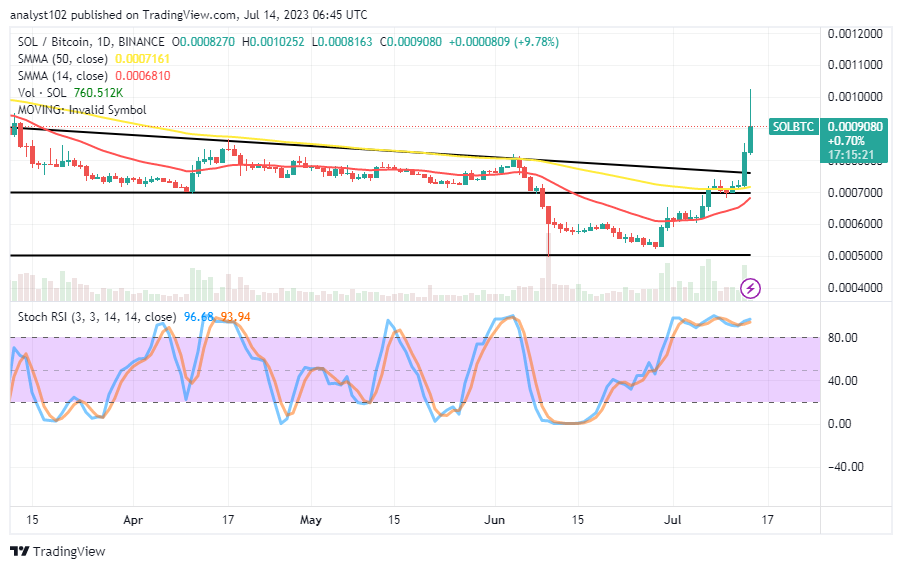
SOL/BTC Price Analysis
In contrast, Solana has spent over two days mooning against Bitcoin, following the consolidation of bulls in the pairing crypto market.
The formation of bullish candlesticks has been prominent, breaking out of a long descending triangle. The 14-day SMA indicator has been pushing upward from beneath the 50-day SMA indicator to portend that base crypto is going on an increase. In order to confirm that counter-crypto has been defeated, the stochastic oscillators have been moving through a consolidation path in the overbought region. Retracement patterns on the climbs, however, have served as a warning against expecting easy rides to the top in the coming days.
Note: Cryptosignals.org is not a financial advisor. Do your research before investing your funds in any financial asset or presented product or event. We are not responsible for your investing results.
You can purchase Lucky Block here. Buy LBLOCK