Solana (SOL/USD) Price Attempts to Move Down to $30
Estimated Reading Time: 3 minutes
Don’t invest unless you’re prepared to lose all the money you invest. This is a high-risk investment and you are unlikely to be protected if something goes wrong. Take 2 minutes to learn more

Free Crypto Signals Channel
Solana Price Prediction – September 16
It noticed that Solana market price attempts to move down against the trading line of the US currency toward the $30 support level. Generally, there is a lees-active downward pressure as price features between $32.42 and $44.25 at an aggregate percentage rate of 1.57 negative.
SOL/USD Market
Key Levels:
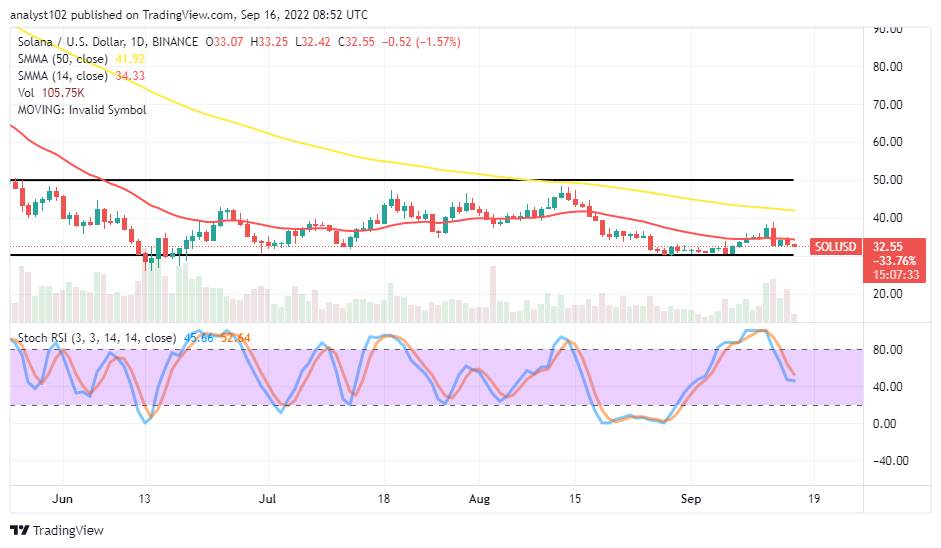
Resistance levels: $40, $45, $50
Support levels: $30, $25, $20
SOL/USD – Daily Chart
The daily chart showcases the crypto-economic price attempts to move down to the $30 support level. We still opined that the market trades within two layers of $50, $40, and $30 value lines over a session. The 14-day SMA indicator is at $34.33 point; underneath the 50-day SMA indicator, which is at $41.92, has traveled southbound from the overbought region to 52.64 and 45.66 range points.
Should the SOL/USD market buyers wait for the Stochastic Oscillator to be in the oversold region before exerting a longing position?
It may unnecessarily technically be inclined to the SOL/USD market buyers to wait for the Stochastic Oscillators to travel into the oversold region before exerting longing positions just as established that the crypto economy is attempting to move to the $30 support level. Long-position placers needed to be alert while a bullish candlestick will surface to signal the return of an upward-trending motion afterward.
On the downside of the technical analysis, at the moment, selling forces below the trend line of the 14-day SMA are experiencing a slight reduction. The trading outlook yet supports that the market can go down to reach its previous lows around the $30 support level as it did many times in the past. Therefore, short-position takers need to be wary of being whipsawed at no time if they intend to ride on any active motion toward the value line, possibly to let the bearish move complete its declining course.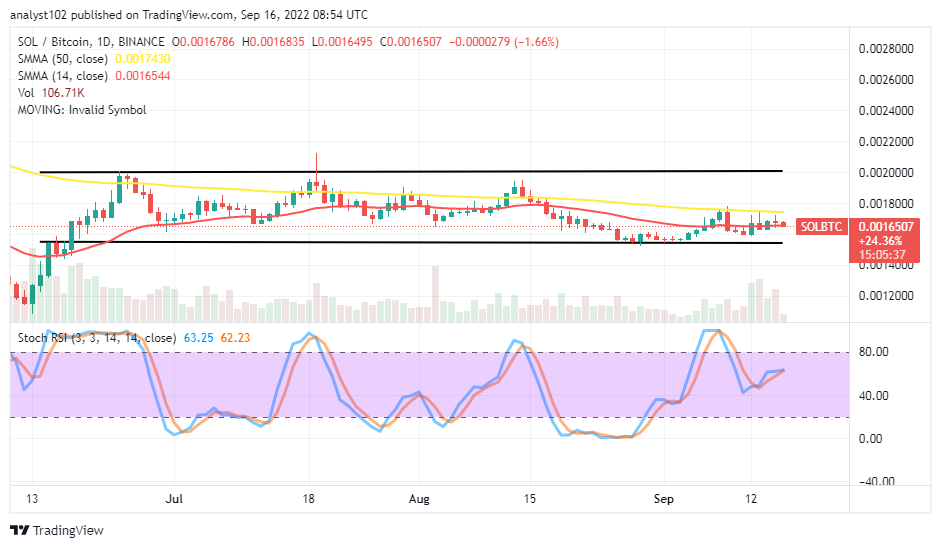
SOL/BTC Price Analysis
The trending pace between Solana and Bitcoin has continued to feature in the formation of ranging at relatively high-trading zones over long sessions. The 14-day SMA trend line is underneath the 50-day SMA indicator. And they keep their moves eastwardly within the range-bound zones. The Stochastic Oscillators have crossed northbound from the range of 40 to the range values of 62.23 and 63.25. Over some days ago, the base crypto has been resisting closely below the bigger SMA trend line to denote the counter crypto may still have control of the market to the former lower-trading spot around the lower horizontal line drawn.
Note: Cryptosignals.org is not a financial advisor. Do your research before investing your funds in any financial asset or presented product or event. We are not responsible for your investing results.
You can purchase Lucky Block here. Buy LBLOCK