Solana (SOL/USD) Price Has Persisted At $20
Estimated Reading Time: 3 minutes
Don’t invest unless you’re prepared to lose all the money you invest. This is a high-risk investment and you are unlikely to be protected if something goes wrong. Take 2 minutes to learn more
Solana Price Prediction – April 7
There has been a continual less-active-moving mode in the business operations of the SOL/USD market as the crypto’s price has persisted at the $20 line overly. That situation has been between $20.78 and $20.25 value lines, keeping a negative percentage rate of 1.07. Presently, buyers appear not to garner the muscles to push for profits away from the point in question in the near time.
SOL/USD Market
Key Levels:
Resistance levels: $25, $27.50, $30
Support levels: $17.50, $15, $12.50
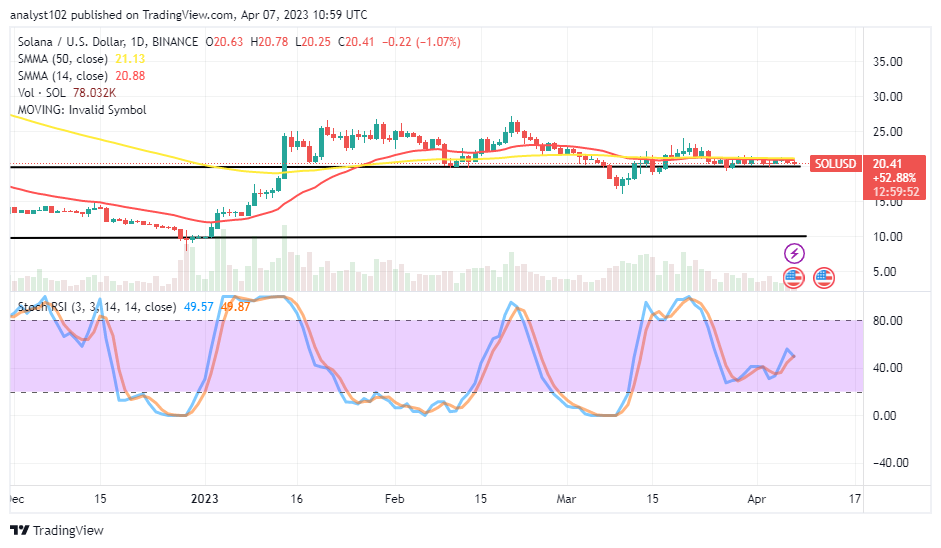
SOL/USD – Daily Chart
The SOL/USD daily chart showcases the market has persisted at the $20 of the upper range line drawn. The 50-day SMA trend line is at a $21.13 value point tightly over the $20.88 line of the 14-day SMA trend line. And they are relatively moving together toward the east direction to indicate the crypto economy’s value is ranging. The Stochastic Oscillators have briefly stepped northbound from the level of 40-short consolidating mode to attempt closing at 49.87 and 49.57 points. That implies a pause is imminent.
Will the SOL/USD market’s tenacity soon wane, and in what direction?
The SOL/USD market’s tenacity waning soon isn’t visible in the near time as the crypto-economic price has persisted at the $20 trading zone for quite a while. As a result of that assumption holding in the trade, the two market movers may continue to prolong their absence, leaving the price to witness more ranges in variant forms devoid of observing order placements. Bulls may anticipate the Stochastic Oscillators shifting to lower significant levels that signal a point to the upside.
On the downside of the technical analysis, the SOL/USD trade bears may pull away briefly from the $20 current trading line to the upside to resume a retracement motion that should break down the upper range line back into the previous sideways trading points. In the wake of that projection-trading plan not coming forth, sellers are advicsed to stay off for some time.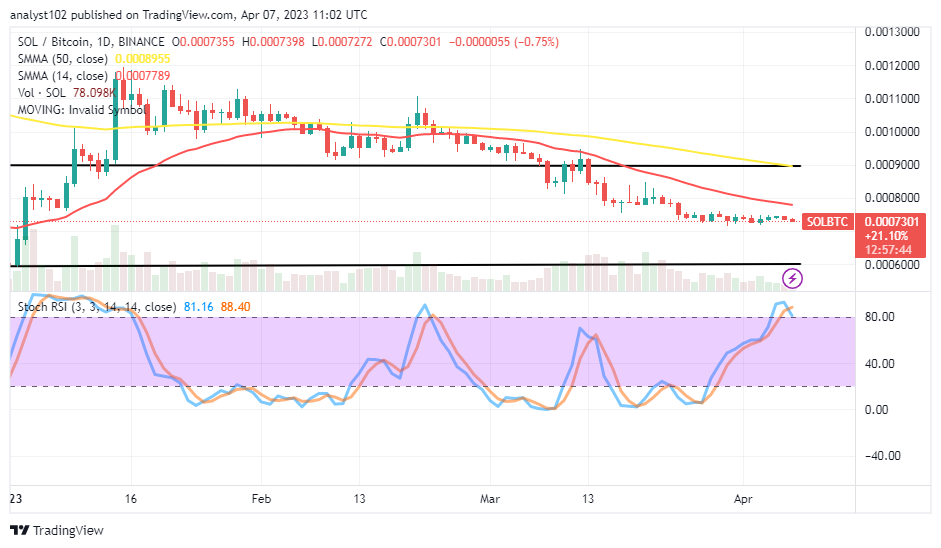
SOL/BTC Price Analysis
In comparison, it appears the Solana trade is not possessing the catalyst to beef up against the trending ability of Bitcoin, as the pair price valuation has persisted underneath the SMA trend lines. The 14-day SMA indicator is beneath the 50-day SMA indicator. The Stochastic Oscillators are in the overbought region, trying to cross their lines to the southbound at 88.40 and 81.16 levels. Even though we are not interested in the moves to the south at this point, long-position takers need to wait for another round of seeing the Stochastics are lower levels before reconsidering a buy in the base market against its counter-trading instrument afterward.
Note: Cryptosignals.org is not a financial advisor. Do your research before investing your funds in any financial asset or presented product or event. We are not responsible for your investing results.
You can purchase Lucky Block here. Buy LBLOCK