Solana (SOL/USD) Price Remains Between $25 and $50
Estimated Reading Time: 3 minutes
Don’t invest unless you’re prepared to lose all the money you invest. This is a high-risk investment and you are unlikely to be protected if something goes wrong. Take 2 minutes to learn more

Free Crypto Signals Channel
Solana Price Prediction – July 29
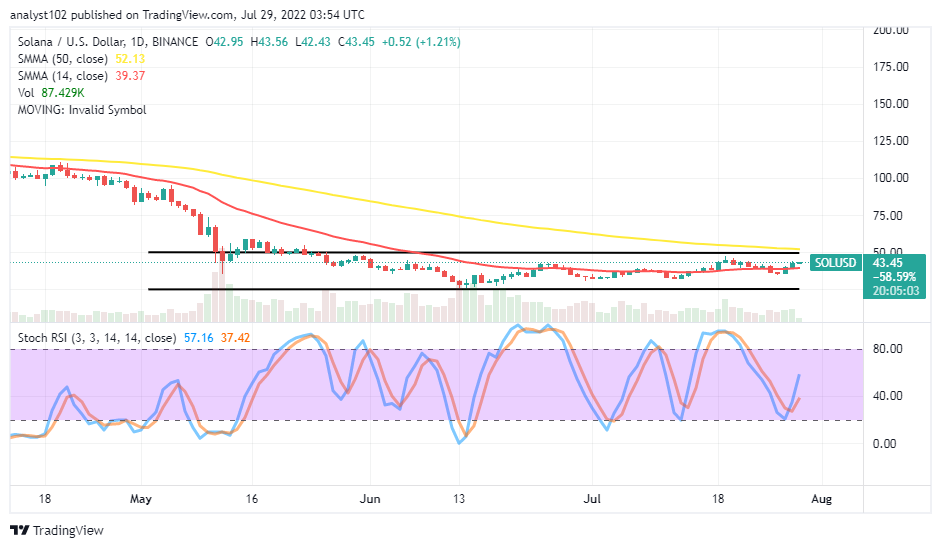
The market valuation of Solana against the worth of the US fiat currency remains between the $25 and $50 value lines. Price is trading around $43 as of writing, showing a positive percentage rate of 1.21.
SOL/USD Market
Key Levels:
Resistance levels: $50, $75, $100
Support levels: $25, $20, $15
SOL/USD – Daily Chart
The BCH/USD daily chart reveals the crypto-economic price remains between $25 and $50. The 14-day SMA trend line is at the39.37 within the range-bound spots underneath the 50-day SMA trend line, which is at the $52.13 resistance point. The Stochastic Oscillators have crossed northbound from the range of 20, pointing toward the north at a higher range line to indicate the crypto economy is pushing for ups.
Has there been a contravening signal against the SOL/USD market tendency of moving more ups now?
The SOL/USD market operations have not had any significant contravening trading situation to back a reversion as the crypto trade remains between the $25 and $50 value lines. Long-position takers ought to have launched a buying order about three days back at a point below the trend line of the 14-day SMA. The main resistance level against getting sustainable ups is at the higher point mentioned earlier.
On the downside of the technical analysis, the SOL/USD market sellers may be getting a better repositioning stance around the trend line of the 50-day SMA at $52.13. Based on that assumption, shorting positions would have to suspend for a while, and a slight reversal move against the trend line of the 14-day SMA in the range-bound zones may systemically go a long way down to revisit the lower range point at $25.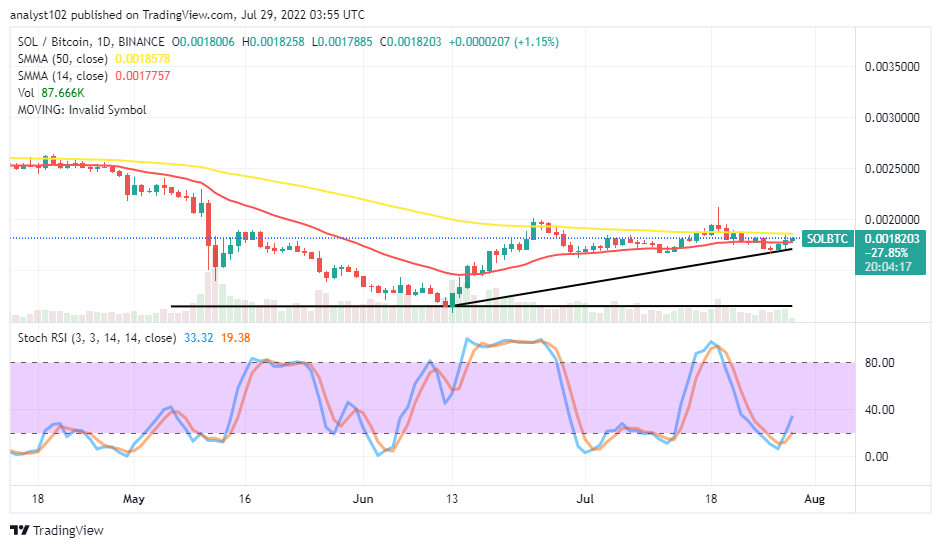
SOL/BTC Price Analysis
Solana is yet to give a damn to a falling force that Bitcoin is tending to pose in the pairing market operations. After notable upswings, the cryptocurrency pair price now ranges between the levels around the SMA trend lines. The 14-day SMA indicator is closely underneath the 50-day SMA indicator. The Stochastic Oscillators have crossed northbound from the oversold region, pointing northbound close to the 40 range. It shows that base crypto is pressing against the trending force against the counter-trading crypto.
Note: Cryptosignals.org is not a financial advisor. Do your research before investing your funds in any financial asset or presented product or event. We are not responsible for your investing results.
You can purchase Lucky Block here. Buy LBLOCK