Synthetix (SNXUSD) Assumes Lower Trend Continuation
Estimated Reading Time: 3 minutes
Don’t invest unless you’re prepared to lose all the money you invest. This is a high-risk investment and you are unlikely to be protected if something goes wrong. Take 2 minutes to learn more
SNXUSD Analysis – Price Assumes Lower Trend Continuation Below the Level of $5.900
SNXUSD assumes a lower trend continuation below the significant level of $5.900. The SNXUSD price experienced a significant outflow of price movement. The price action follows a bearish movement as the price is seen settling downward. This is because the bears encourage the holders to keep applying more pressure to the market. As long as the price influence turns into an increase, the market will keep flowing downward.
SNXUSD Significant Zones:
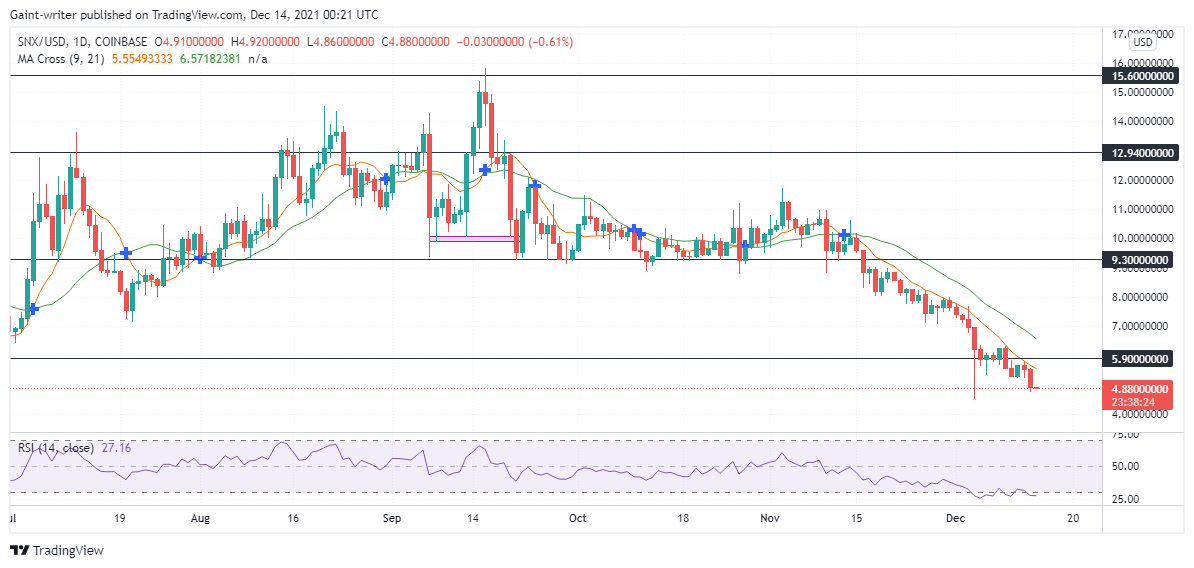
Resistance Zones: $15.600, $12.940
Support Zones: $9.300, $5.900
SNXUSD bulls fell into the trap and are yet to recover. The market was first encouraged with a significant upward moment. The price first moves with sane momentum. As price poured out up to the 15.600 price level, the bulls were seen to have price influence. Following the market’s upswing, the price action got hit by the bears in the market. The bears, however, follow a lower trend as price movement continues to halve downward. When price movement arrived at the 9.300 significant level, the bulls tried to start a war with the bears as price movement ranged in the accumulation phase.
The price movement then continues after a break in long accumulation around the $9.300 level of significance. After a break, the market assumes a lower direction due to bearish influence. However, as the price proceeded downward, another significant level was broken. The market broke through the $5.900 significant level and the bears are set to trend downward. Despite the bearish control, the price is expected to pull back to the $5.900 level before continuing. The RSI (Relative Strength Index) tells us that the market is signaling an oversold region and the price is expected to hold back before bearish continuation.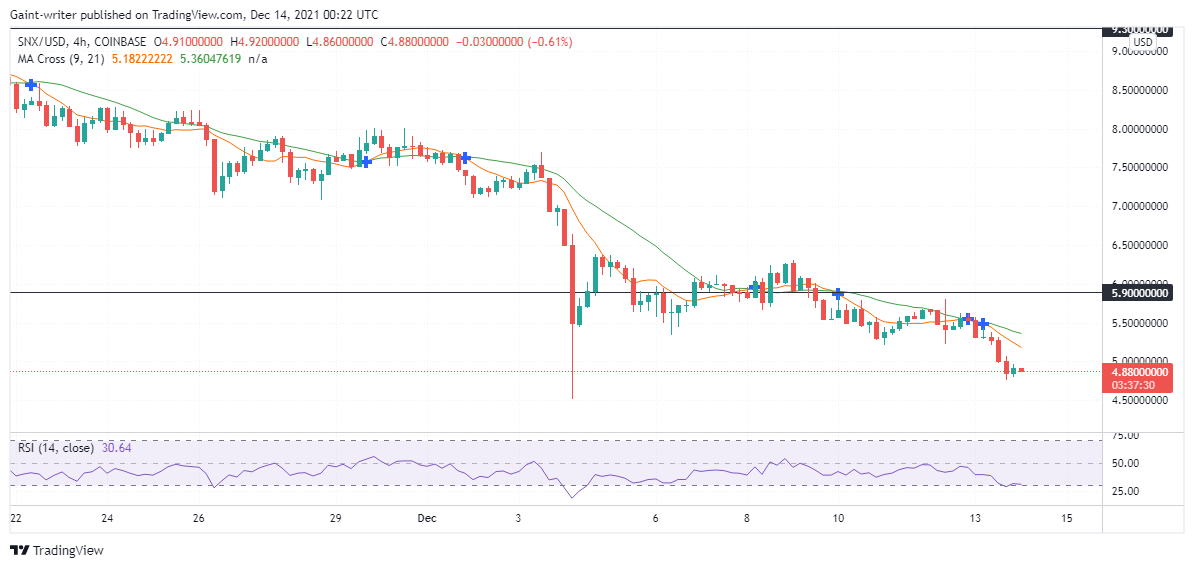
Market Prospect
The 4-hour chart displays price movement settling down in the bearish phase, and the moving average crossing shows the general direction of the market phase. However, a pullback is therefore expected before price movement continues below the $5.900 significant level as the RSI shows sellers’ strength.
You can purchase crypto coins here: Buy Tokens
Note: Cryptosignals.org is not a financial advisor. Do your research before investing your funds in any financial asset or presented product or event. We are not responsible for your investing results.