Synthetix (SNXUSD) Bullish Run Challenged
Estimated Reading Time: 3 minutes
Don’t invest unless you’re prepared to lose all the money you invest. This is a high-risk investment and you are unlikely to be protected if something goes wrong. Take 2 minutes to learn more
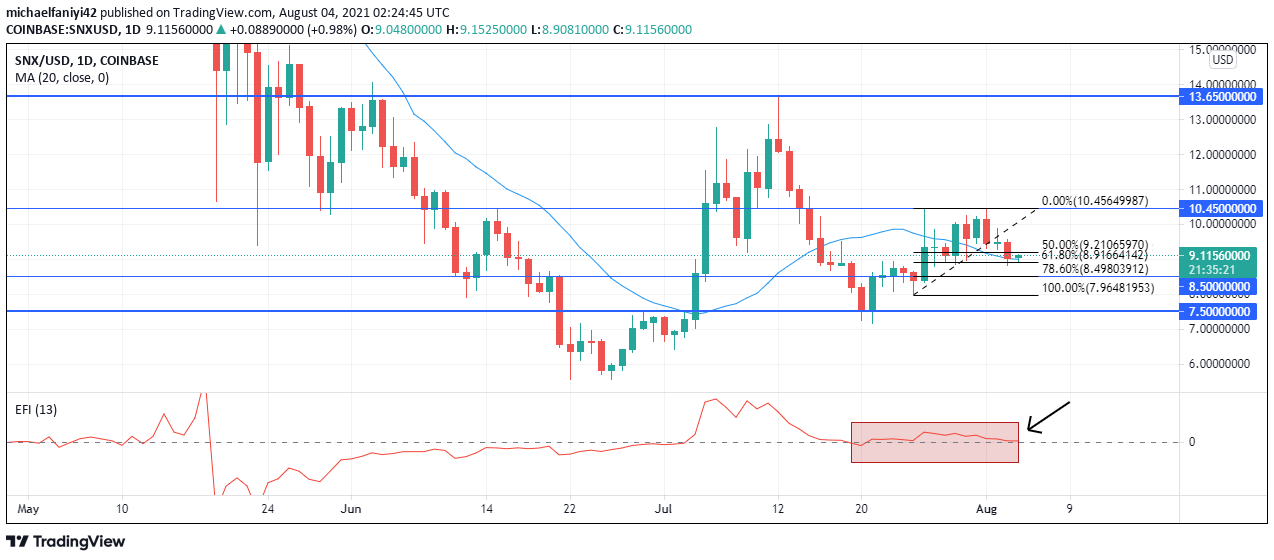
Market Analysis – SNXUSD Impressive Bullish Run Challenged at $10.450
SNXUSD bullish run began on the 20th of July 2021, when price bounced off the resistance price point at $7.500. The bulls took over the market and drove price to $10.450, an impressive 40% price gain in just six days. However, the momentum of the bulls appeared to have cooled off as the coin has failed to break our $10.450 resistance line, despite testing the area repeatedly in the past few days.
Key Levels
Resistance Levels: $10.450, $13.650
Support Levels: $7.500, $8.500
Plotting the daily chart with the EFI (Elder Force Index) indicator, we see that the force line on the indicator began trading above the zero mark on 20th July, (the same day the price started the bullish run from $7.500), thereby confirming the bullish run. The MA period 20 (Moving Average) is also now positioned below the daily candlesticks to support the market’s bullish run.
We also see that despite repeated price rejection at $10.450 resistance, and price dipping to the downside, the Elder Force Index has refused to break below the zero mark to correlate with sellers, thus indicating a strong bullish presence behind the scene. Thus, the EFI shows us that buyers are still around and are willing to move the coin’s price to higher objectives.

Market Prospects
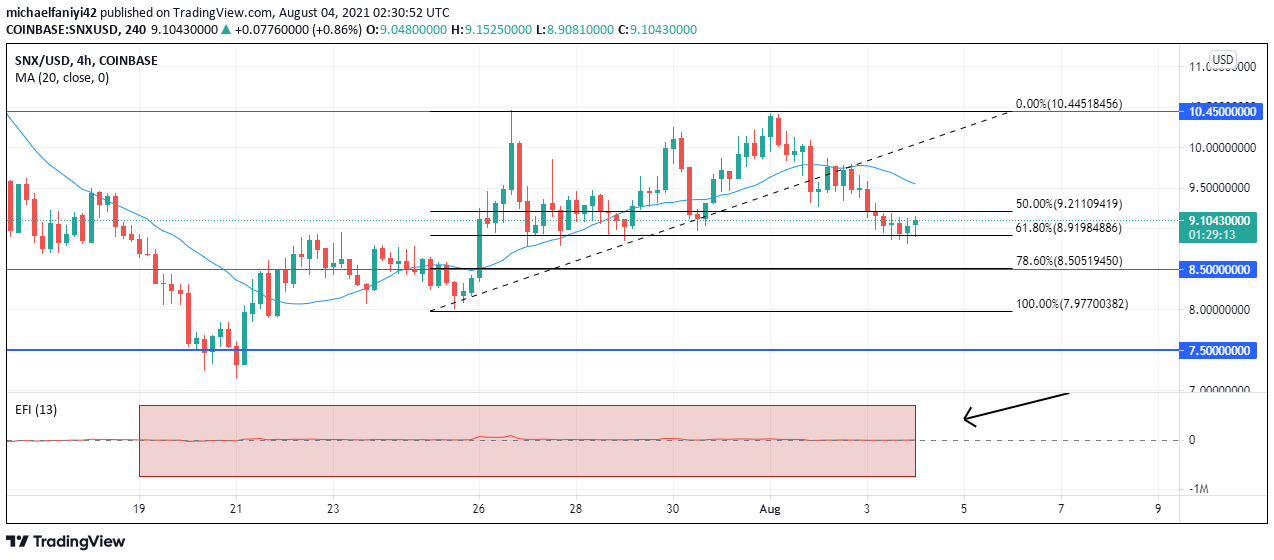
Scaling down to the 4-hour timeframe, we can observe that price is currently in a retracement stage after touching the $10.450 resistance point and assuming temporary bearishness. This is confirmed by the MA 20 stationed above the 4-hour chart.
Plotting the Fibonacci tool on the 4-hour chart, we can see the 78% point of the fib aligning with our minor support point of $8.500. The Fibs 78% is statistically used to find the level of continuity of a trend. Therefore, with the 78% level aligning with our support point, $8.500 could offer us an opportunity to go long on SNXUSD in hope of the continuation of the impressive bullish run so far.
If the bulls come into the market at our outlined support area, we could see a continuation of the SNXUSD bullish run, first above the $10.450 level, then in the coming days, into the $13.650 resistance point above.
You can purchase crypto coins here: Buy Tokens
Note: Cryptosignal.org is not a financial advisor. Do your research before investing your funds in any financial asset or presented product or event. We are not responsible for your investing results.