Synthetix (SNXUSD) Shows Signs of Change in the Market Trend
Estimated Reading Time: 2 minutes
Don’t invest unless you’re prepared to lose all the money you invest. This is a high-risk investment and you are unlikely to be protected if something goes wrong. Take 2 minutes to learn more

Free Crypto Signals Channel
SNXUSD Analysis – Market Shows Signs of Change in Market Trend
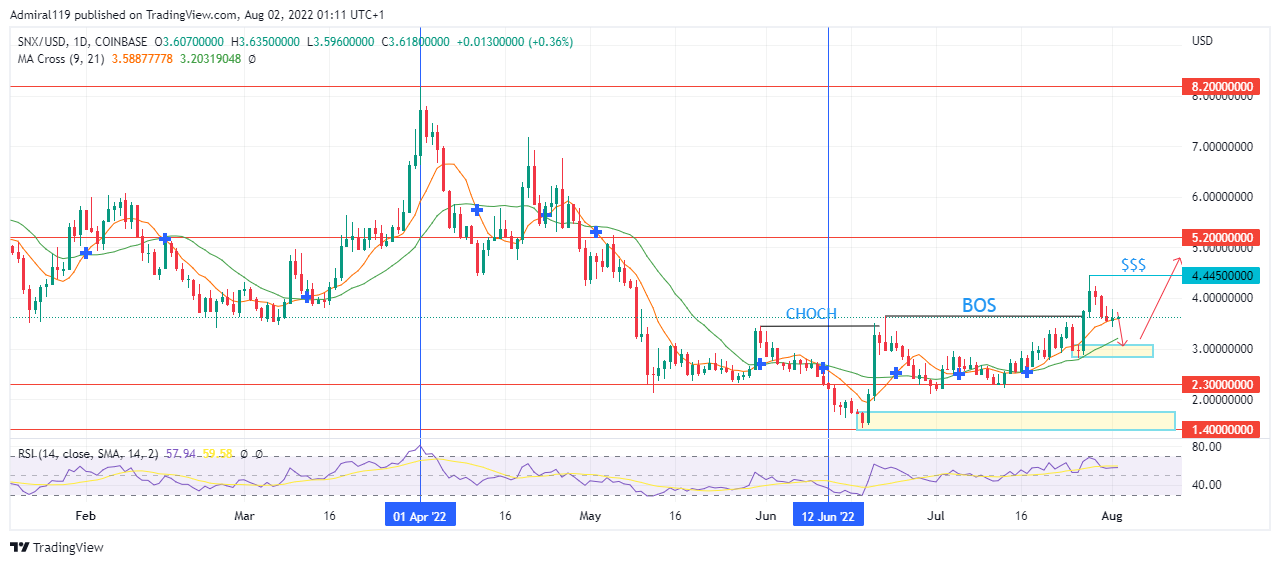
SNXUSD shows signs of change in the market trend. The just concluded market trend began its downward move on the 1st of April this year. The market trend continued as SNXUSD kept on breaking all the supports along its way until the support at $1.40 was reached.
SNXUSD Major Zones
Supply Zones: $8.20, $5.20
Demand Zones: $2.30, $1.40
The break of the support at $2.30 on the 12th of June, 2022, led prices toward the immediate support downward. The reaction of the market at the support of $1.40 showed that a very large volume of buy orders were sitting on the support. The sudden input of the buy orders led to the Change of Character (CHOCH). CHOCH means a shift in market structure as the market flips either bearish or bullish.
After the successful change of character, prices retraced downward to hit the support level at $2.30 until they entered into an oversold region, just like how they entered into the overbought region on the 1st of April, 2022, as indicated by the Relative Strength Index (RSI). The SNXUSD then rallied upward to break the market structure, which further confirmed the change in market trend to an uptrend.
Market Expectation
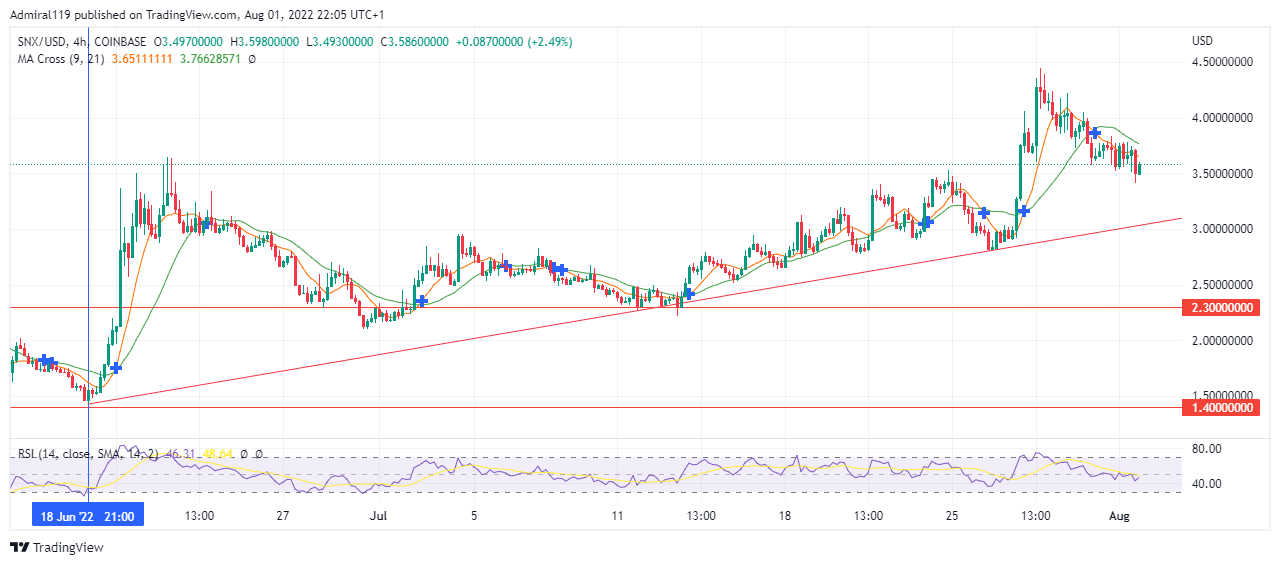
In the four-hour timeframe, the market’s order flow appears bullish. This upward trend began in the four-hour timeframe on the 18th of June, 2022. Prices broke the previous resistance at $2.30 only to retest it multiple times before resuming the uptrend. The four-hour timeframe trendline further confirmed that the market trend is currently an uptrend. The bears are expected to drive the prices towards either the four-hour timeframe trendline or the demand zone at $2.30.
You can purchase Lucky Block here. Buy LBLOCK
Note: Cryptosignals.org is not a financial advisor. Do your research before investing your funds in any financial asset or presented product or event. We are not responsible for your investing results.