The $2.500 Support Prevents Bancor (BNTUSD) From Sinking Further and Pushes the Price Upwards
Estimated Reading Time: 2 minutes
Don’t invest unless you’re prepared to lose all the money you invest. This is a high-risk investment and you are unlikely to be protected if something goes wrong. Take 2 minutes to learn more
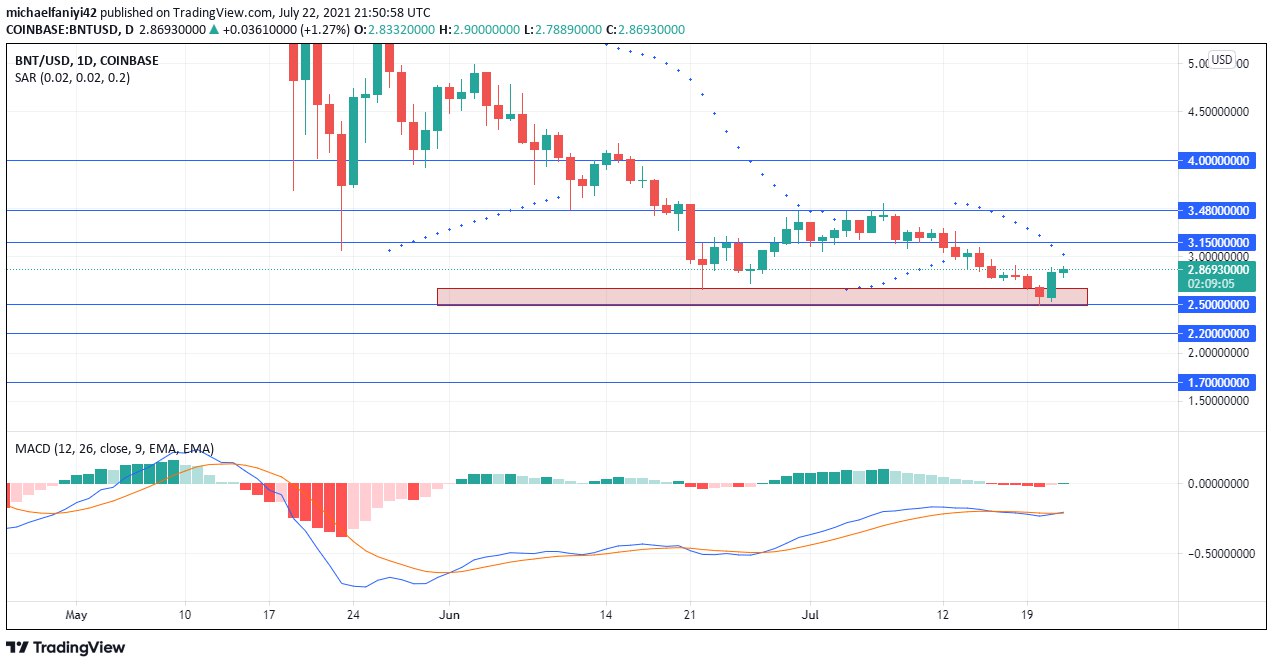
Price Analysis – Bancor Prevents Further Lows by Springing up From the $2.500 Support
The $2.500 support has kept the market from sinking below it again. This is the second time in the space of a month that this support has prevented price from going below. The first time was on the 22nd of June 2021, when the coin plunged from the $3.480 support. The support held price and pushed it upward. Bancor didn’t take off as expected as it was repelled at the $3.150 resistance, but more push from below fired it past the resistance.
Bancor Key Levels
Resistance Levels: $3.150, $3.480, $4.000
Support Levels: $1.700, $2.200, $2.500
The coin eventually got above the $3.150 resistance but was unable to surmount the $3.480 barrier. After ranging with the $3.150 support for 2 weeks, the market subsided gradually till it fell back to the $2.500 support on the 20th of July 2021. The next day, bulls were revitalized and the market formed a bullish Haramis candle to push Bancor to the $2.860 price level.
As of the time of writing, the market has formed a Doji candle which has its low at $2.788 and its high at $2.900. The coin will have to make more upside movement before it can be counted as a change in direction. Hence, the Parabolic SAR (Stop and Reverse) still indicates a downtrend. The MACD (Moving Average Convergence Divergence), meanwhile, has shown the first bullish histogram bar. Its signal lines also cross each other to move upward. This indicates the start of a bullish trend.

Market Prospects
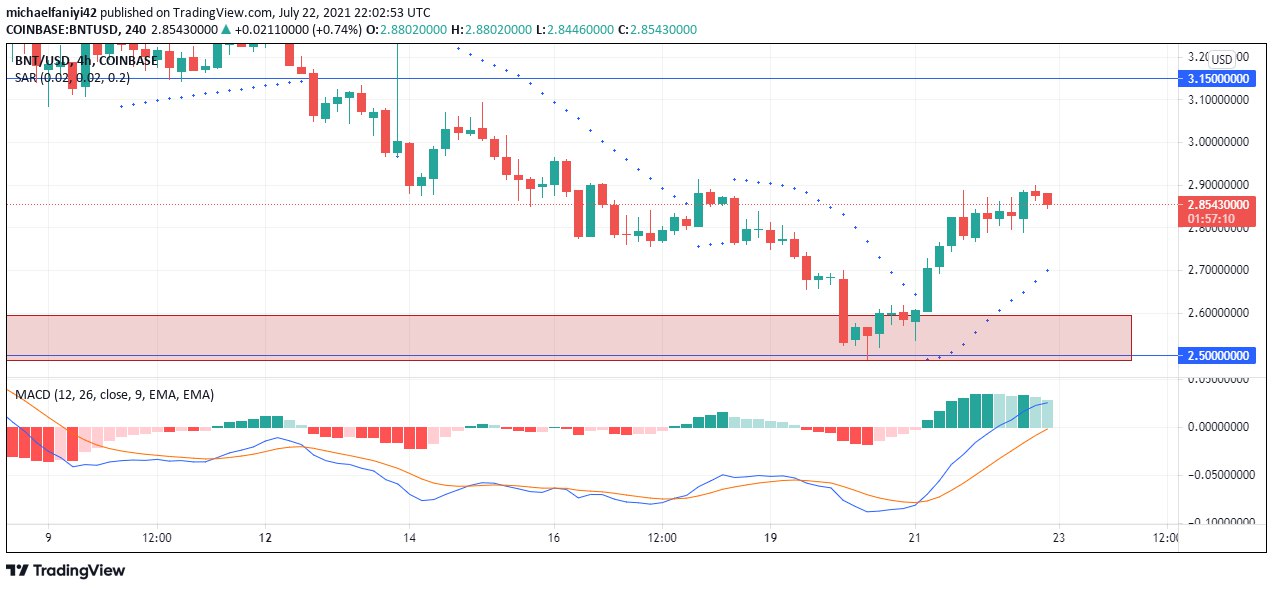
On the 4-hour chart, the market is already seen as bullish. The Parabolic Stop and Reverse already has 11 dots stationed below the candles. The blue signal line of the MACD has climbed above the zero level, and there are already series of bullish histogram bars lined up. This shows a bullish market impulse.
The coin is expected to first reach the $3.150 key level, before forging further upwards.
You can purchase crypto coins here: Buy Tokens
Note: Cryptosignal.org is not a financial advisor. Do your research before investing your funds in any financial asset or presented product or event. We are not responsible for your investing results.