UMA (UMAUSD) Begins Its Bullish Revival
Estimated Reading Time: 2 minutes
Don’t invest unless you’re prepared to lose all the money you invest. This is a high-risk investment and you are unlikely to be protected if something goes wrong. Take 2 minutes to learn more
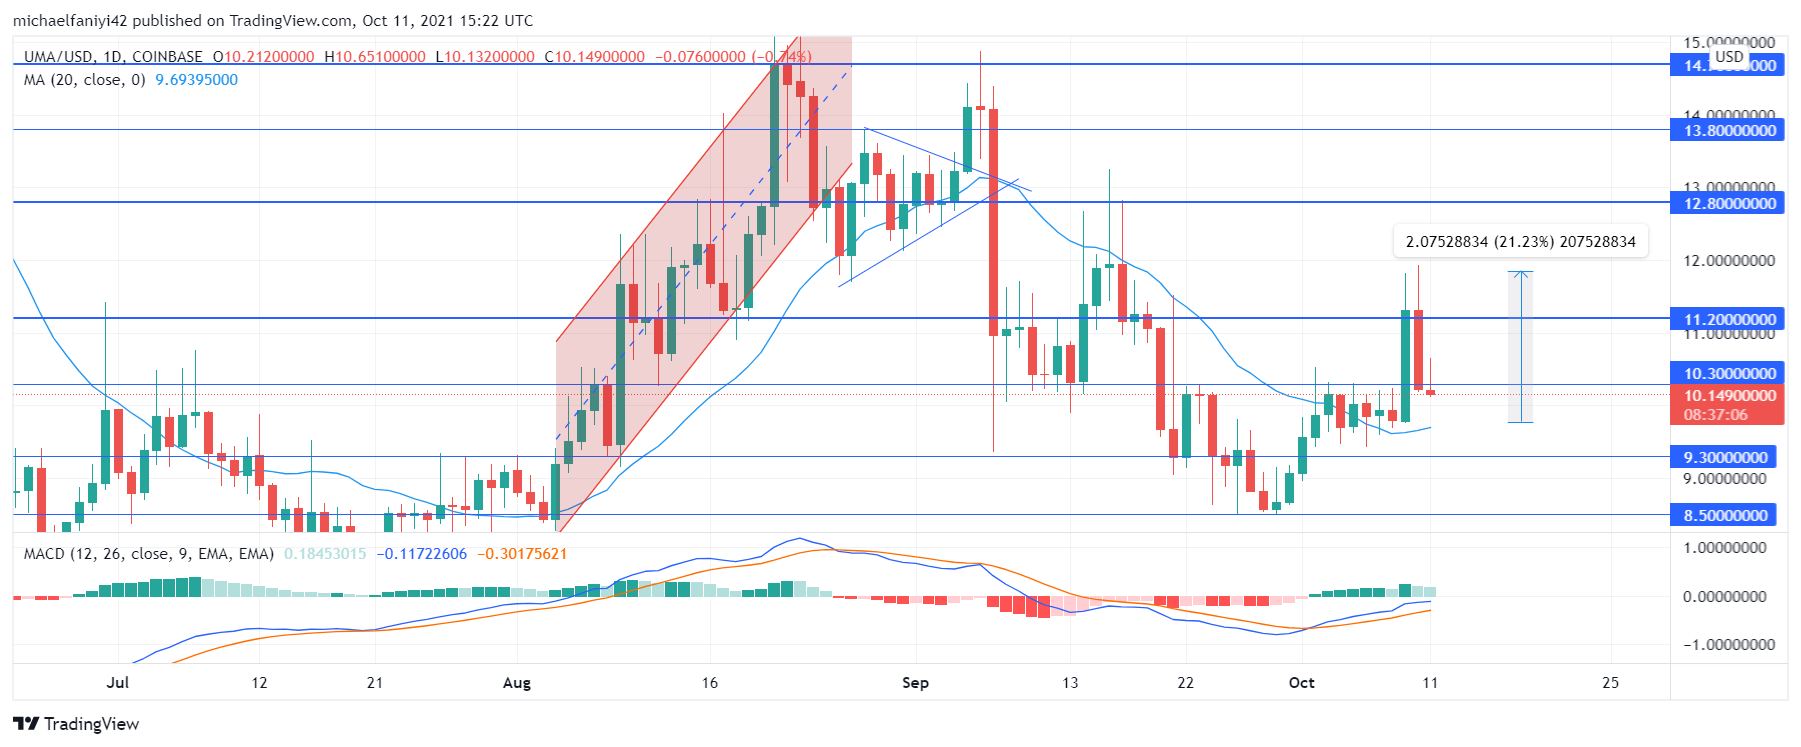
UMA Analysis – Price Begins Bullish Revival Above the $9.300 Key Level
UMA begins its bullish revival after dropping to the $8.500 support level. A reversal was ensured utilizing a morning star candlestick pattern. From there, the coin climbed above the $9.300 key level, where it consolidated for a while, being unable to immediately break through the $10.300 resistance level.
UMA Important Levels
Resistance Levels: 11.200, 12.800, 13.800
Support Levels: 10.300, 9.300, 8.500
After eight days of consolidation between $10.300 and $9.300, UMA surged upward and begins a bullish revival. The coin rose 20% to climb above $11.200, but it fell back immediately with the same intensity under pressure. This is still a result of the scuffle which buyers and sellers have been engaged in.
Price has now dropped and is reacting around the $10.300 key level. The market will struggle to hold above it, though holding above it will help the market launch another assault on the $11.200 resistance level. All the parameters are in place for the bulls to take advantage of. The MA period 20 (Moving Average) has taken its place firmly below the market as a support as the price begins its bullish revival. The Moving Average Convergence Divergence (MACD) has shown a strong upturn in the market as its lines have crossed in an upward direction.

Market Prospect
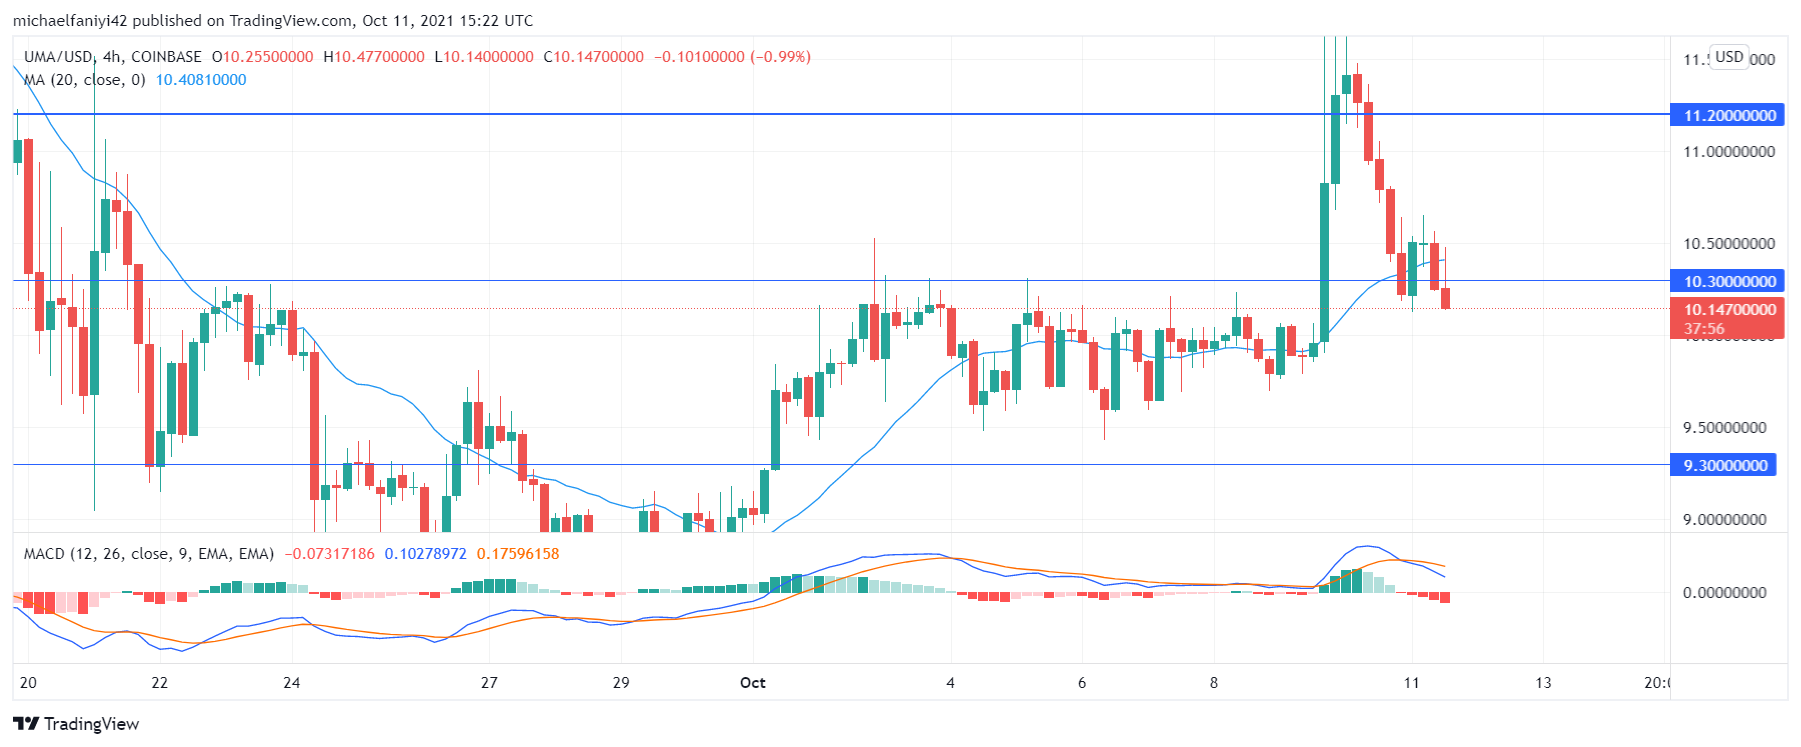
The 4-hour chart shows the strong bullish intent of the buyers and a corresponding repressing effort from the bears. The MACD chart shows the coin having a sudden surge upward and then crossing downward again. Buyers, however, are set to have the upper hand here. The market could go through another period of consolidation above the $10.300 price level till bulls build greater momentum as the $11.200 resistance level proves impenetrable.
If the coin breaks above $11.200, it will aim for $12.800 next.
You can purchase crypto coins here: Buy Tokens
Note: Cryptosignals.org is not a financial advisor. Do your research before investing your funds in any financial asset or presented product or event. We are not responsible for your investing results.