UMA (UMAUSD) Fails in Its Bid for an Upward Push
Estimated Reading Time: 3 minutes
Don’t invest unless you’re prepared to lose all the money you invest. This is a high-risk investment and you are unlikely to be protected if something goes wrong. Take 2 minutes to learn more
UMA Analysis – The Market Fails to Rise to a Higher Price After a Failed Bullish Structure
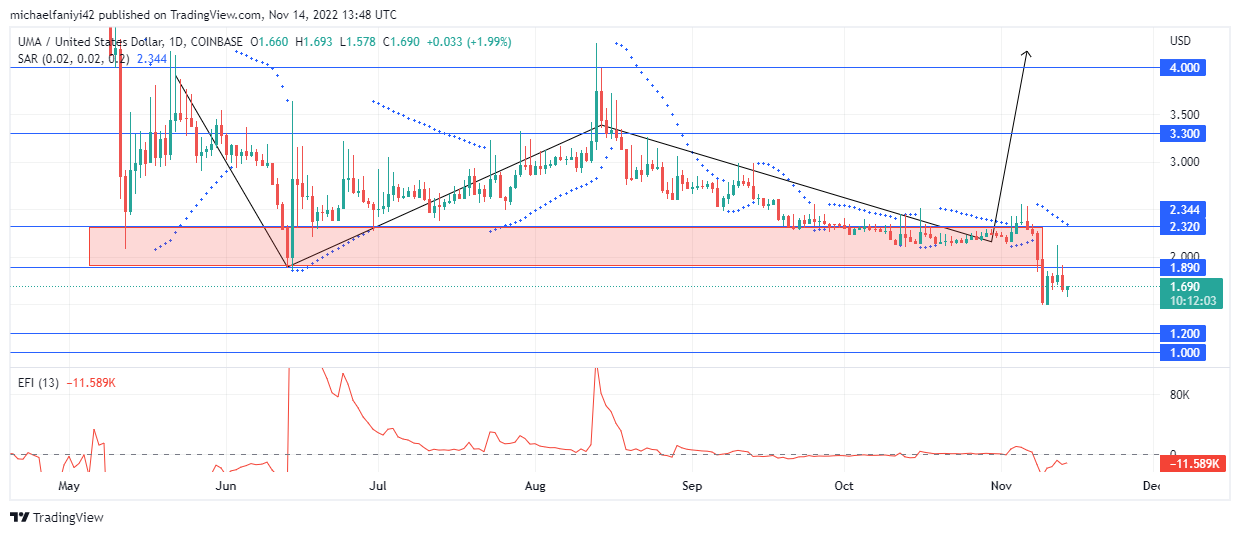
UMA fails in its bid to reach a higher price level after its bullish structure fails at the last stroke. The buyers have been trying to lift the mood in the market. Their best move so far has been to structure the market into a bullish reversal structure to push the price higher. This goes according to plan until the structure breaks down at the last stroke. The sellers have taken over once more as the market plunges to a new low.
UMA Important Levels
Resistance Level: $4.000, $3.300
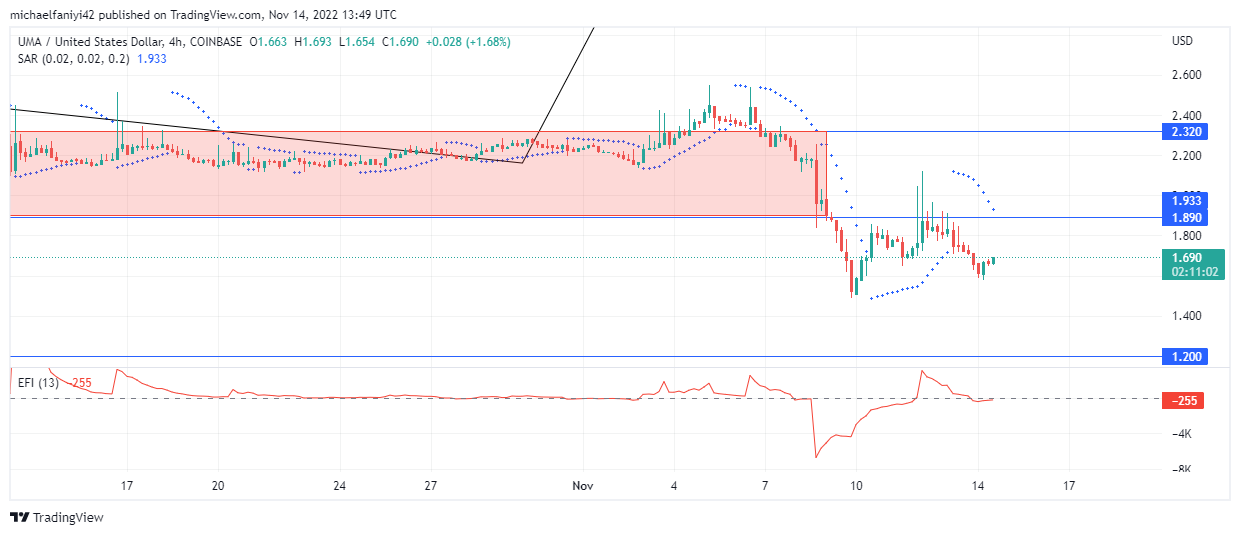
Support Levels: $2.320, $1.890
When the price fell for the first time this year to the $2.320 key level on May 12th, it immediately rebounded and rose to $4.000.Their uptrend was cut off from there, and the price dropped back. It will, however, rise to test the $4.000 level again on the 13th of August, and be rejected once again. Nevertheless, those two experiences helped to set the $4.000 as a neckline and the $2.320 as a base for a potential bullish structure.
The candlesticks got back to the base at $2.320 and needed one more push up to $4.000 to form a bullish structure that will propel the price higher. However, that did not happen, as the price slipped and instead dropped lower. The Parabolic SAR (Stop and Reverse) dots hang above the daily candles as the coin plunges below the next support level at $1.890. The Elders Force Index, which had previously been oscillating around equilibrium, has now fallen to a negative value.
Market Expectation
Another bearish session is now on course as the bears seize control of the market once again. The strength of the $2.320 support base stretches to $1.890, but both have now been breached. This sets the next touchdown level at $1.200. The candles rose again to retest the $1.890 level and then began to fall after rejection, with the parabolic SAR dots hanging above. The retest made the EFI line temporarily rise into a positive value; it is now back below. $1.200 is the most likely destination.
You can purchase Lucky Block here. Buy LBLOCK
Note: Cryptosignals.org is not a financial advisor. Do your research before investing your funds in any financial asset or presented product or event. We are not responsible for your investing results.