UMA (UMAUSD) Is Attempting a Previous Reversal Trick at $8.500
Estimated Reading Time: 2 minutes
Don’t invest unless you’re prepared to lose all the money you invest. This is a high-risk investment and you are unlikely to be protected if something goes wrong. Take 2 minutes to learn more
UMA Analysis – Price Is Attempting to Reverse at $8.500
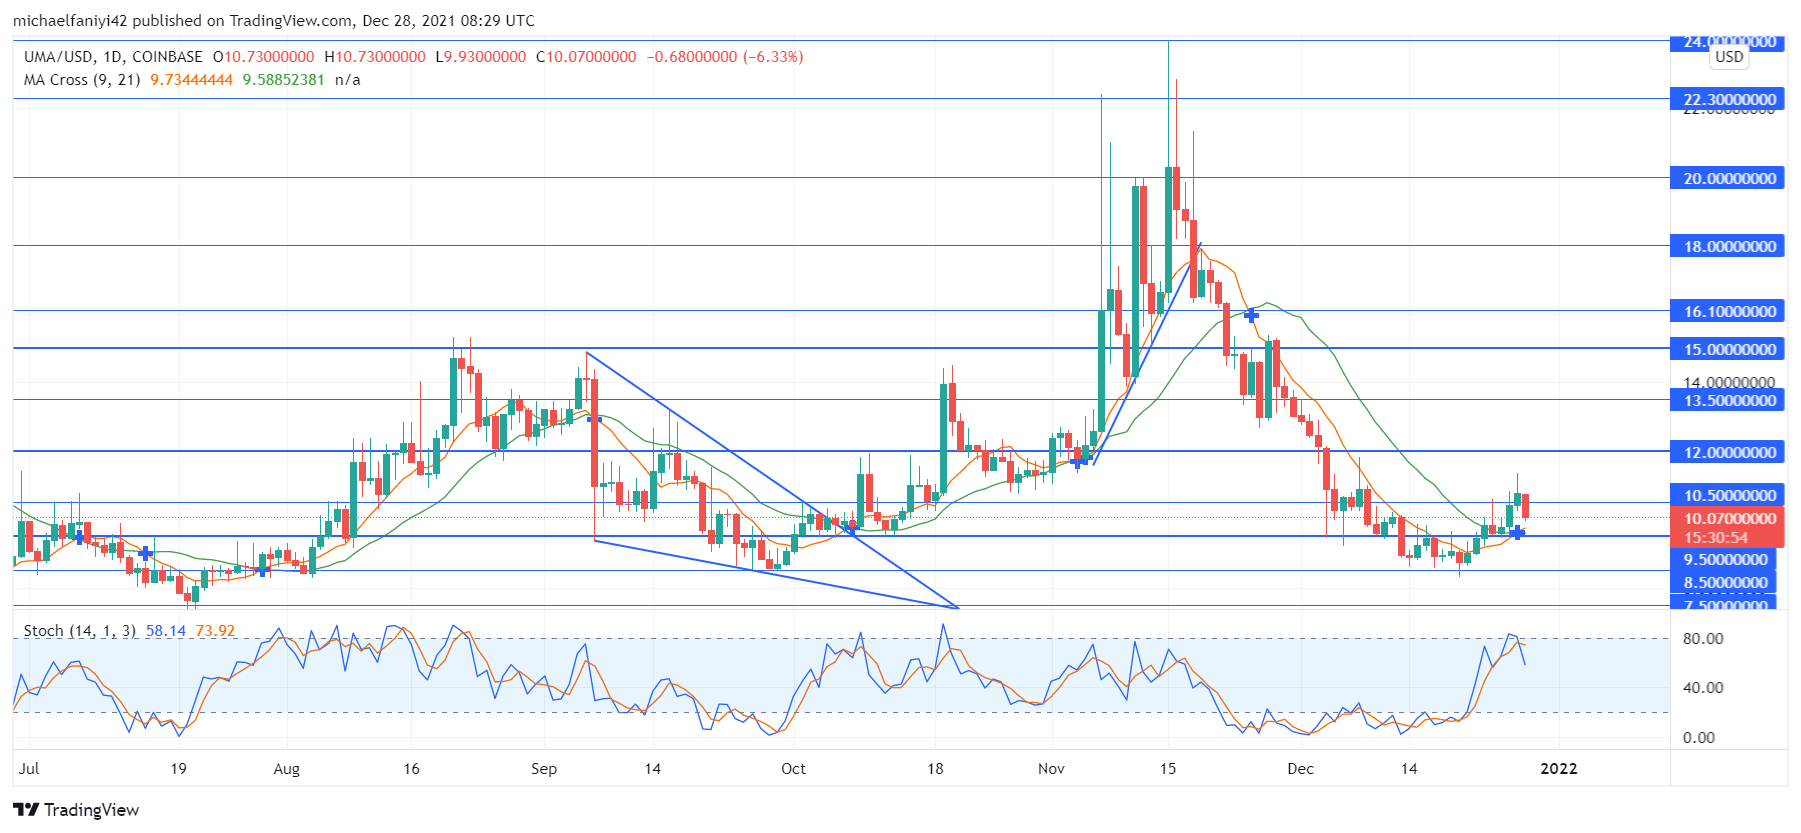
UMA is attempting to implement a reversal trick with which it used to good effect previously. The coin has been suffering from bearish pressure that stretches back to the 16th of November. The result is a 65% plunge in price. During the period, there was a free fall in the market in which UMA bypassed several key levels till it landed at $8.500. At this level, the market is now attempting a previously successful reversal trick.
UMA Critical Levels
Resistance Levels: $10.000, $12.000, $20.000
Support Levels: $7.500, $8.500, $9.500
The coin implemented a reversal at this level previously as bears and bulls clashed. On the 7th of September, the price dropped below $12.000 into the reversal zone. A retest of $12.000 plunged it further to $8.500. It is at this level that the bulls gather their strength to confront the bearish push. This led to an increase in price to $9.500. What followed was a period of market agitation that eventually led to a breakout above $12.000.
This led to a rise in the market that reached beyond $20.000 before bearish pressure resumed again. In a month, UMA has crashed back to $9.500 and then further to $8.500. As previously, bulls have gathered strength and are attempting to launch a reverse again. They have taken the first step to push the price back to $9.500. The Stochastic Oscillator emphasizes current bullish strength as its lines approach overbought.

Market Expectations
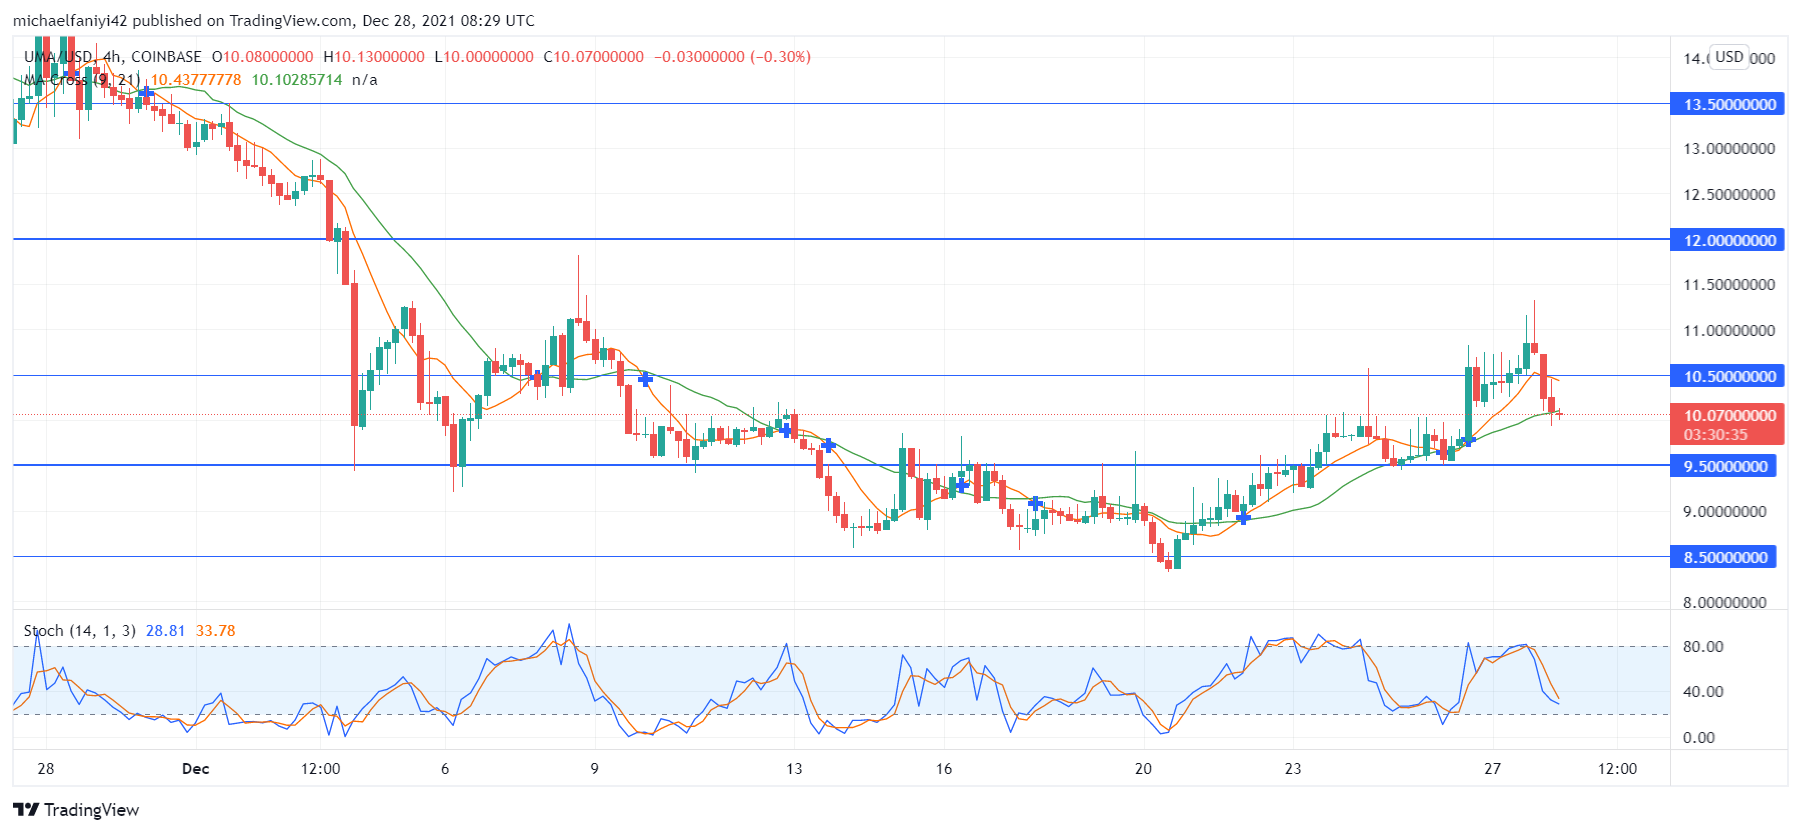
On the 4-hour chart, the MA periods 9 and 21 (Moving Averages) are following the daily chart, having crossed upward. The coin has retested at $9.500 and is currently attempting to push past $10.500. The Stochastic Oscillator has stopped short of entering oversold and is showing a sign of an impending retracement before the coin continues its uptrend.
You can purchase crypto coins here: Buy Tokens
Note: Cryptosignals.org is not a financial advisor. Do your research before investing your funds in any financial asset or presented product or event. We are not responsible for your investing results.