UMA (UMAUSD) Remains Indecisive Below a Significant Zone
Estimated Reading Time: 3 minutes
Don’t invest unless you’re prepared to lose all the money you invest. This is a high-risk investment and you are unlikely to be protected if something goes wrong. Take 2 minutes to learn more
UMA Analysis – Price Remains Indecisive Below a Significant Price Range
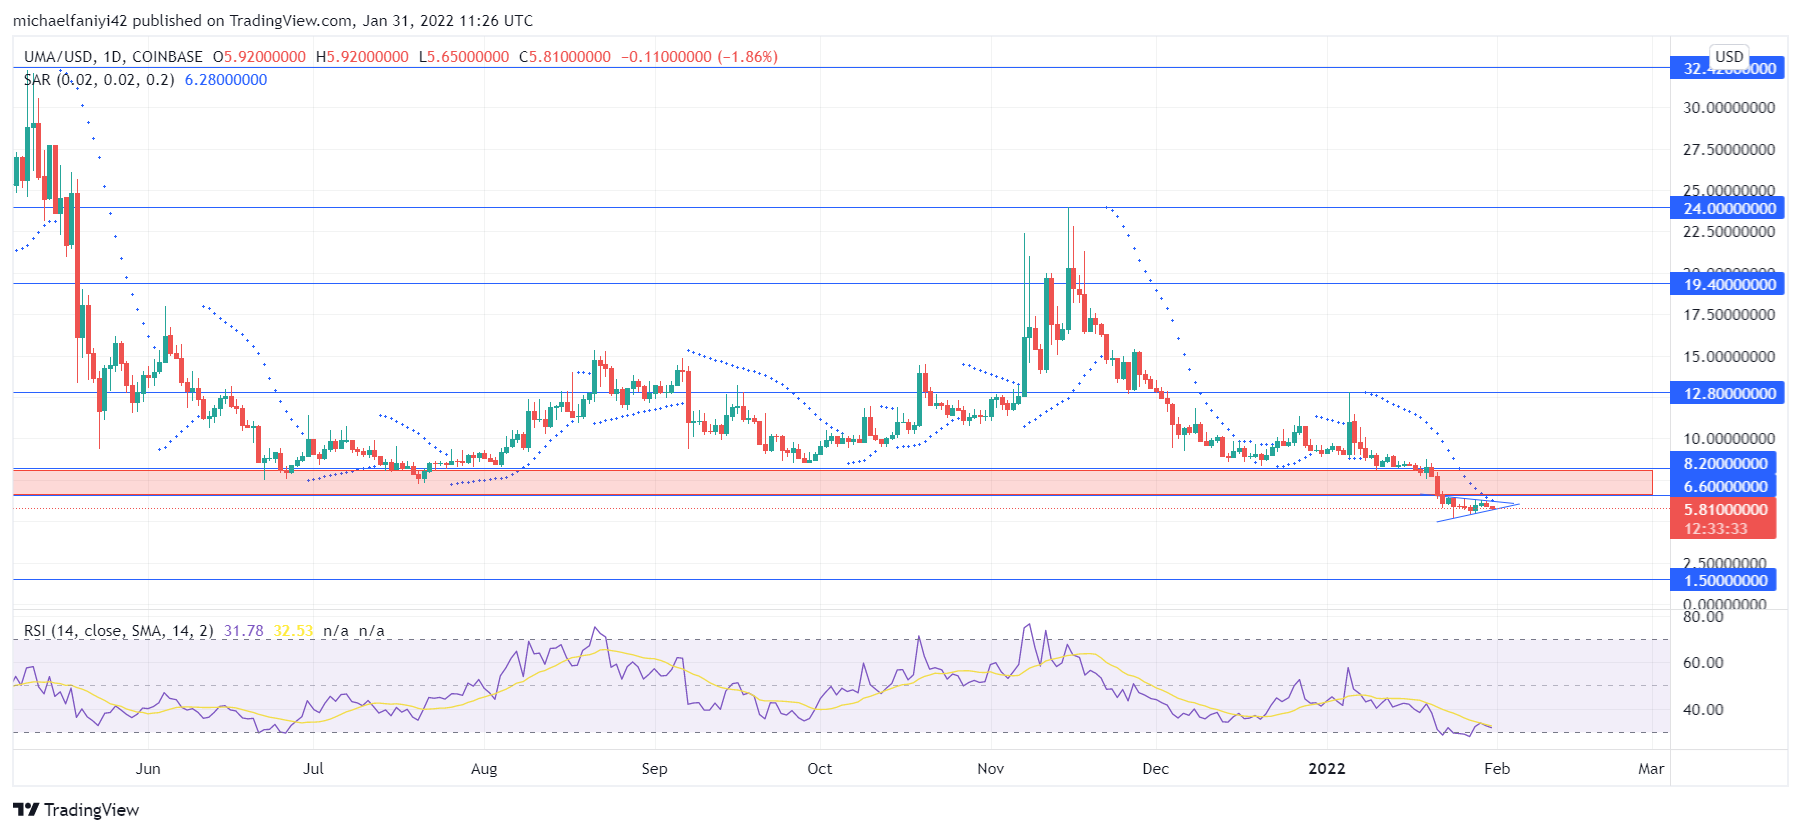
UMA remains indecisive and quiet, and it maintains a subdued movement below the $8.200-$6.600 price level. For the past ten days, the absence of market influences, whether bullish or bearish, means the price has kept a sideways movement. This was also the case three weeks ago when the market laid low above the $8.200 price level. Then last week, on the 21st, sellers dragged the market forcefully through the strong support zone from $8.200-$6.600.
UMA Key Levels
Resistance Levels: $24.000, $19.400, $12.800
Support Levels: $8.200, $6.600, $1.500
Just before the price got beaten below $8.200, the price had been undulating in a wild manner since the May 18th global crypto drop. The highest point the price got to was $24.000, while it kept crashing down to $8.200. The continuous crashing down to the $8.200 support is a sign that the market has always been under a more bearish influence than bullish influence.
Eventually, bears took their dominance further and drove the price through the strong support zone. After the price fell below $6.600, the bears were weakened, and neither the bulls nor the bears took advantage of the market’s weakness. Therefore, the price remains rangebound below the $6.600 price level. The Parabolic SAR (Stop and Reverse) shows market bearish strength, but that has brought the RSI (Relative Strength Index) line to an oversold region, indicating an imminent reversal.

Market Prospects
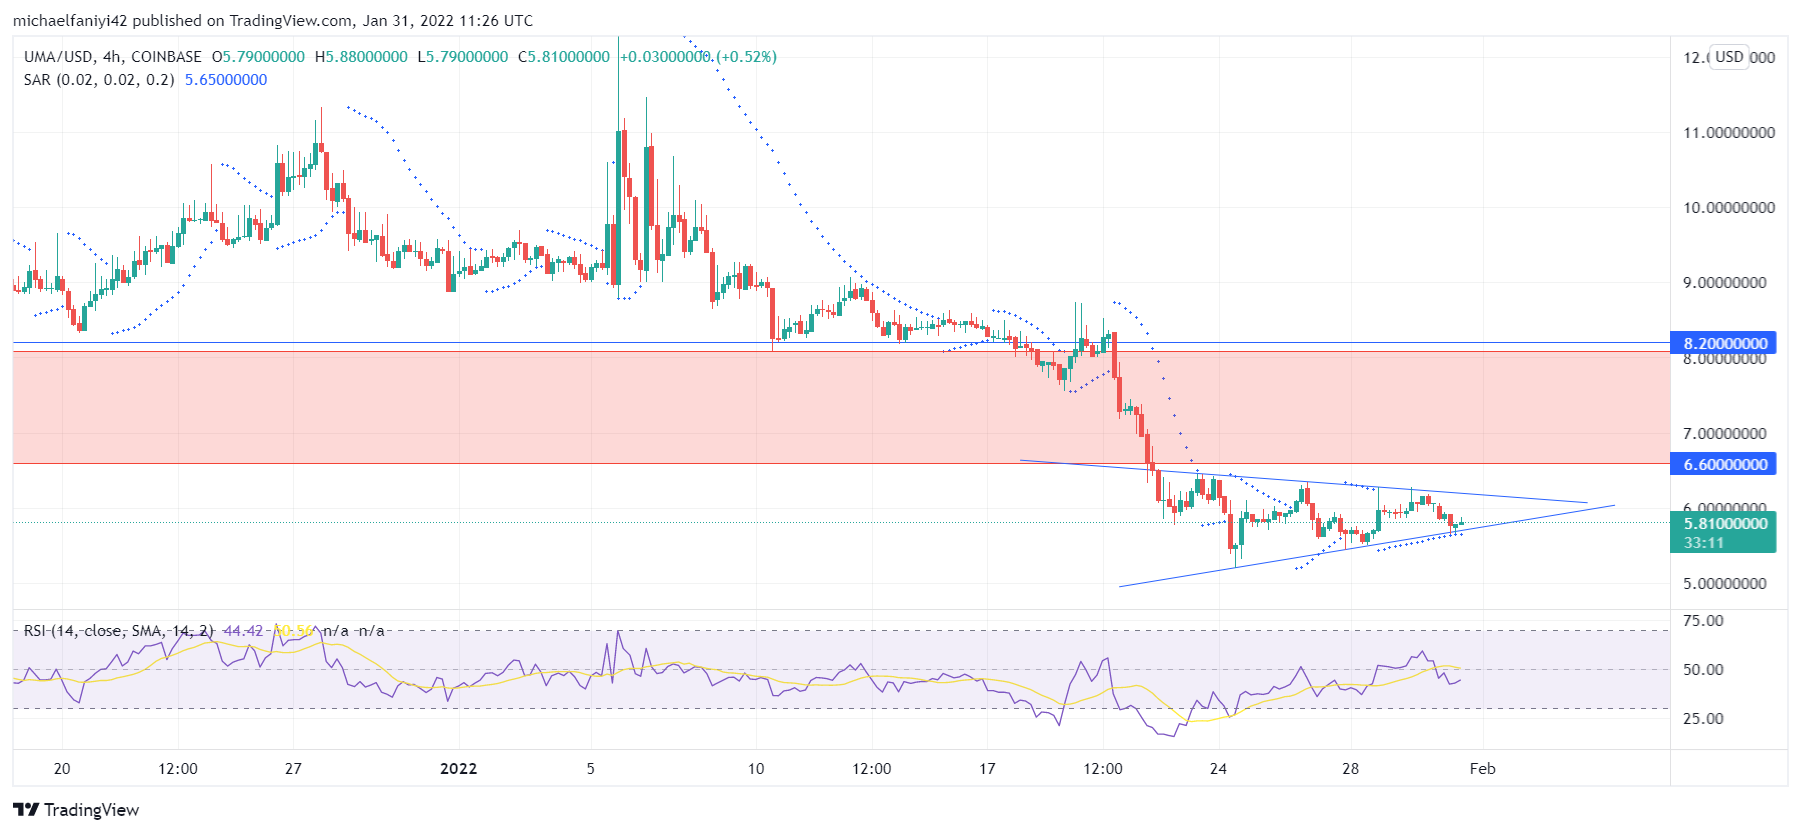
The 4-hour chart shows more positive movement from the bulls. The market is now conforming to a symmetrical triangle pattern, which could lead to a breakout upward or downward. But the RSI line is observed to be ascending towards the bullish half, making consistent higher lows and highs. It will take a lot of momentum for the price to break through the $8.200-$6.600 zone upwards.
Rejection in the zone could directly or indirectly lead to a further plunge towards $1.500 before further market reactions.
You can purchase crypto coins here: Buy Tokens
Note: Cryptosignals.org is not a financial advisor. Do your research before investing your funds in any financial asset or presented product or event. We are not responsible for your investing results.