UMA (UMAUSD) Surges but Fails to Hold Above $4.000
Estimated Reading Time: 2 minutes
Don’t invest unless you’re prepared to lose all the money you invest. This is a high-risk investment and you are unlikely to be protected if something goes wrong. Take 2 minutes to learn more

Free Crypto Signals Channel
UMAUSD Analysis – The Market Surges but Fails to Hold Above $4.000
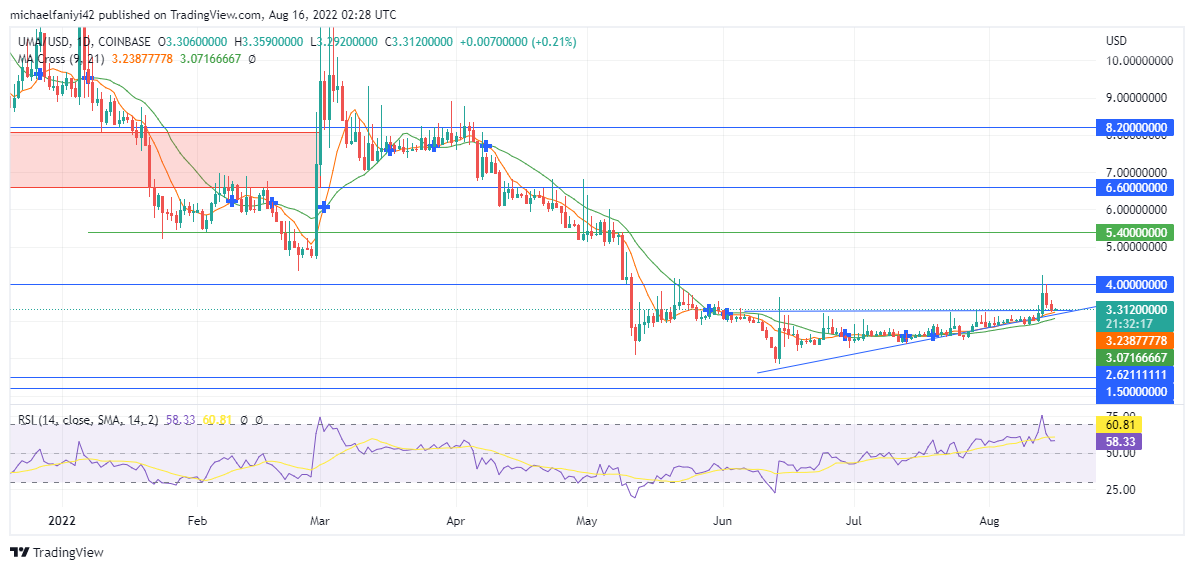
UMAUSD surges upward after a long-drawn consolidation in a triangle formation. The buyers intended to use the triangle formation to cause a reversal in the market. However, after tapering through the triangle for more than two months, the price eventually rallied, breaking the triangle’s resistance, and then the price surged to the $4.000 level, only to experience a swift drop back to the triangle border.
UMAUSD Significant Zones
Supply Levels: $4.000, $5.400
Demand Levels: $1.50, $1.20
The bears have more or less owned the market since the beginning of the year. If at all, there were only a few short periods in which the market was influenced by the buyers. Accumulation of the influences on the price led it to plunge to almost $1.500. Nevertheless, the bulls are taking advantage of the sloppiness of the sellers to redirect the coin using a triangle pattern.
The triangle pattern takes several weeks to form and immediately breaks out upon reaching the peak of the triangle pattern. The price surges upward, piercing through the triangle border and the $4.000 resistance level. However, the buyers were unable to hold above the $4.000 level, which caused an instant drop back above the border of the triangle pattern. The MA Cross (Moving Average Cross) has crossed upward and continues to act as support beneath the daily candles.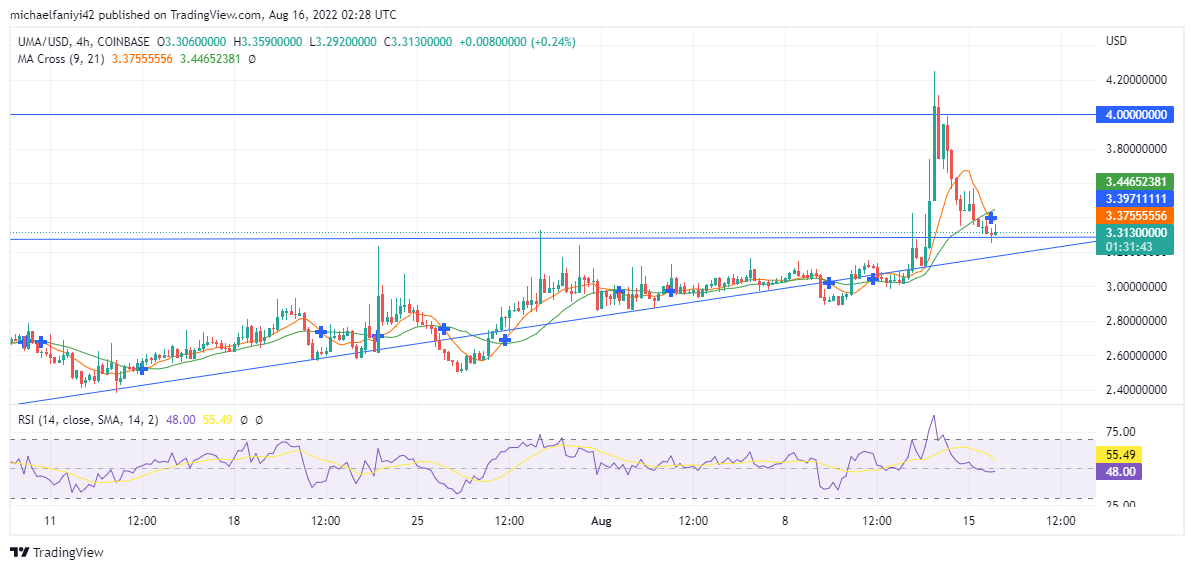
Market Expectation
On the daily chart, the RSI (Relative Strength Index) maintains an upward trajectory despite the setback that befalls the market. But on the 4-hour chart, the RSI line has dropped, but it remains above the zero line. This is still an indication of a bullish market. The price is expected to bounce back from the triangle border to retest and break the $4.000 level and reach for $5.400.
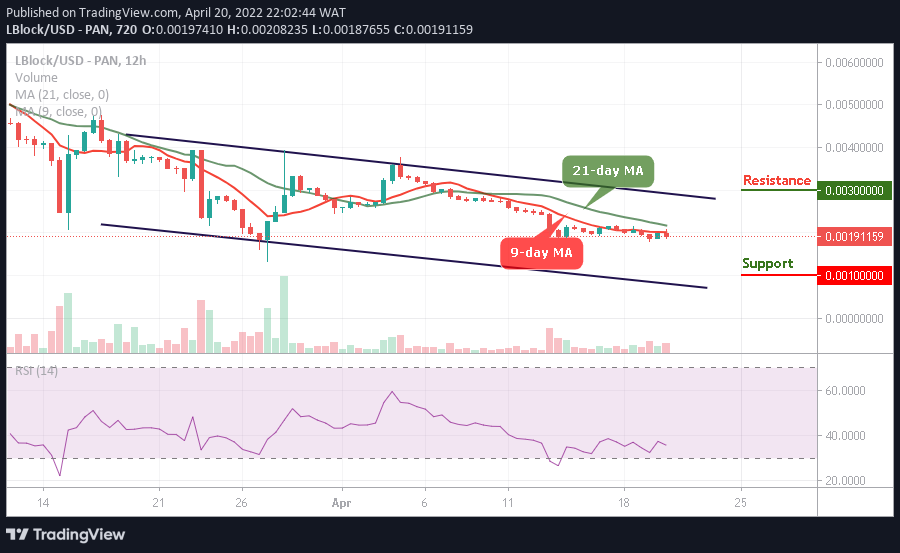
You can purchase Lucky Block here. Buy LBLOCK
Note: Cryptosignals.org is not a financial advisor. Do your research before investing your funds in any financial asset or presented product or event. We are not responsible for your investing results.