Uniswap (UNI/USD) Market Falls From $5.50, Swinging at $5
Estimated Reading Time: 3 minutes
Don’t invest unless you’re prepared to lose all the money you invest. This is a high-risk investment and you are unlikely to be protected if something goes wrong. Take 2 minutes to learn more
Uniswap Price Prediction – June 29
Following an overbought transaction condition that took place barely five days ago, the crypto market has made a change of direction to produce a fall from $5.50, swinging at the $5 trade line.
In the wake of that situation, buyers; reactions have gained a minute positive percentage rate of 0.53 to trade between the maximal and minimal value lines of $4.8588609 and $48194259. Nevertheless, the path to the downside still has a viable chance of pushing further beyond its current trade zone.
UNI/USD Market
Key Levels:
Resistance levels: $5.50, $6, $6.50
Support levels: $4, $3.50, $3
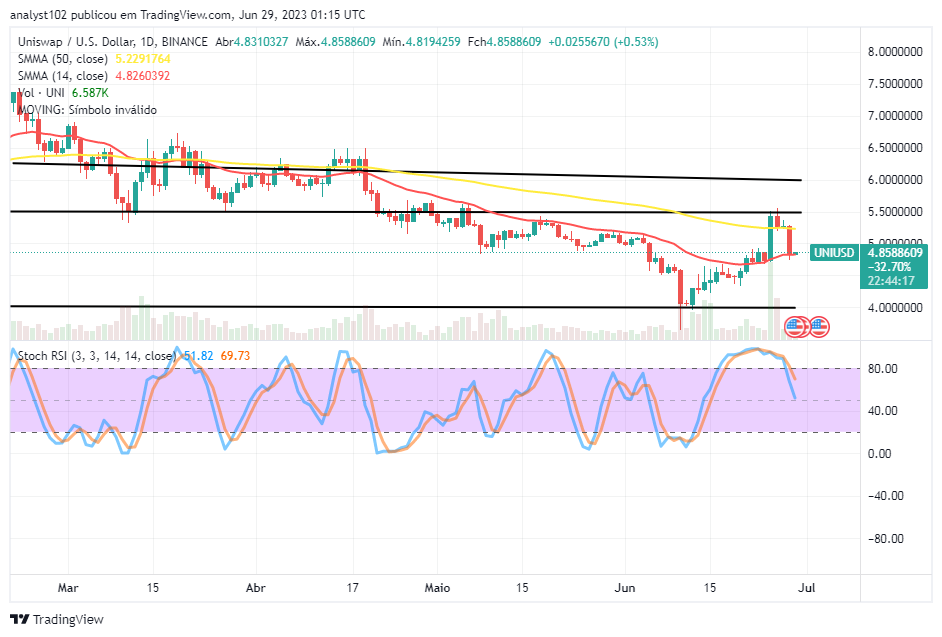
UNI/USD – Daily Chart
The UNI/USD daily chart showcases the crypto-economic market falling from 5.50, swinging at the $5 value line for a respite to decide on a real-time exchanging propensity to nudge into in the subsequent operations.
The present progressive financial reports on the chart show that a candlestick has formed around the trend line of the smaller one, carrying a lighter positive trade at the lower end of the formation of a marginal bearish candlestick that occurred during yesterday’s operation in a continuation of decline. The 14-day SMA is at $4.8250392, below the $5.2291764 point of the 50-day SMA. The Stochastic Oscillators have crossed southbound from the overbought region to stay between 69.73 and 51.82 points.
Will there be more fall-offs to push through variant underlying supports to average the support at $4?
It is still possible to see some further lows in the UNI/USD market operations below the trend line of the 14-day as it has been obtained that the crypto-economic market falls from $5.50, swinging at $5 and taking a breath before deciding on the next direction.
Talking about the upside analytical write-up at this moment, long-position takers are enjoined to exercise a lot of patience toward seeing that the velocity backing the recent falling journey gains a negation index from the reading of the Oscillators before bracing up for some degrees of ups.
On the downside of the technical analysis, as there has been a sharp reduction moment from the upper horizontal line of $5.50, shorting entries are bound to create alongside the bearish wall of candlestick that featured yesterday. Therefore, bears will have to be strategically positioned by looking out for active motion that can break the trade zone of $5 to the downside.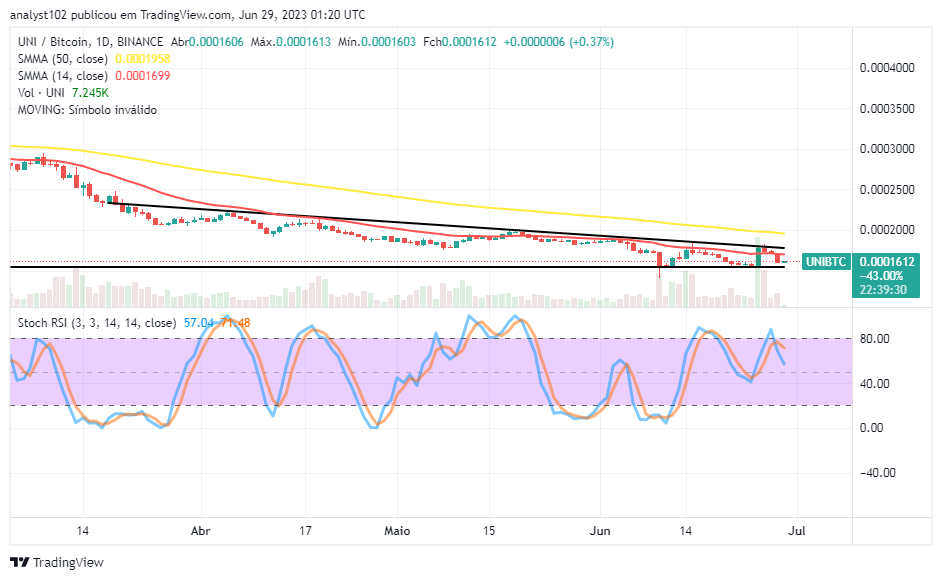
UNI/BTC Price Analysis
In contrast, the Uniswap market falls from the bearish trend line drawn over the candlesticks featuring around the smaller indicator.
The 14-day SMA trend line is positioned beneath the trend line of the 50-day SMA trend line. The horizontal line and the bearish trend line have depicted the pairing of cryptocurrencies trading in a triangular pattern. The Stochastic Oscillators have crossed from 71.48 to 57.04. However, the subsequent declines might not last for long, even if there is a chance for more reductions afterward.
Note: Cryptosignals.org is not a financial advisor. Do your research before investing your funds in any financial asset or presented product or event. We are not responsible for your investing results.
You can purchase Lucky Block here. Buy LBLOCK