Uniswap (UNI/USD) Market Follows a Bearish Move, Hitting a Resistance
Estimated Reading Time: 3 minutes
Don’t invest unless you’re prepared to lose all the money you invest. This is a high-risk investment and you are unlikely to be protected if something goes wrong. Take 2 minutes to learn more
Uniswap Price Prediction – June 1
The UNI/USD market follows a bearish move, hitting a resistance as the crypto-economic price trades around a minute negative percentage rate of 0.62. Bulls and bears’ reactions have capped between $5.0544554 and $4.9556073. A selling path that has been over time is what caused that momentum loss. Based on the trading psyche, long-position placers will eventually emerge, likely over or near the $4.50 support level after taking some time to restructure.
UNI/USD Market
Key Levels:
Resistance levels: $5.50, $6, $6.50
Support levels: $4.50, $4, $3.50
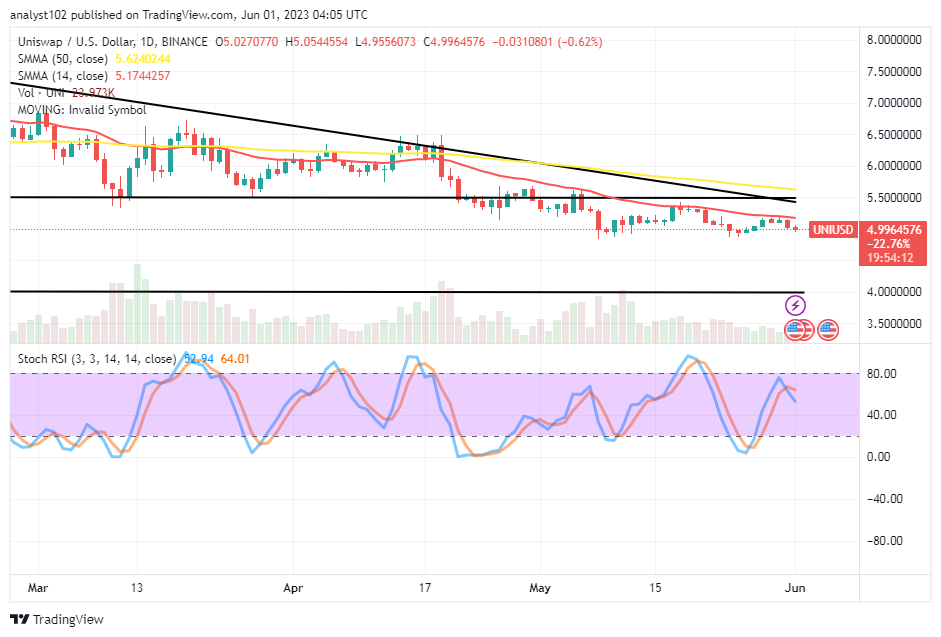
UNI/USD – Daily Chart
The UNI/USD daily chart reveals the crypto-economic market follows a bearish move, hitting a resistance of around $5.20. The 14-day SMA indicator is at $5.1744257, underneath the $5.6240244 of the 50-day SMA indicator. The Stochastic Oscillators have crossed slightly southbound from 80 to 64.01 to 52.94 points. The positioning of the Oscillators portends a warning of jumping into the market by launching a buy order.
Will the bulls who support the UNI/USD market revert to the $4.50 support level?
Buying momentum may not lose the stance to revisit the $4.50 support level as the crypto-economic market follows a bearish move, hitting a resistance point beneath the $5.50 resistance level. Presently, the UNI/USD trade formation obtainable showcases an index of exercising cautiousness toward making a buyback order. Nevertheless, investors are advised to hold buying positions that might have opened at a higher trading zone below the SMA trend lines.
On the downward-shifting positions of the technical analysis, traders intending to maintain a shorting order in this trade should take to reactions of the 14-day SMA’s point. Sellers might be capitalizing on the current declining force provided that the resistance point of $5.1744257 isn’t broken out aggressively in no time.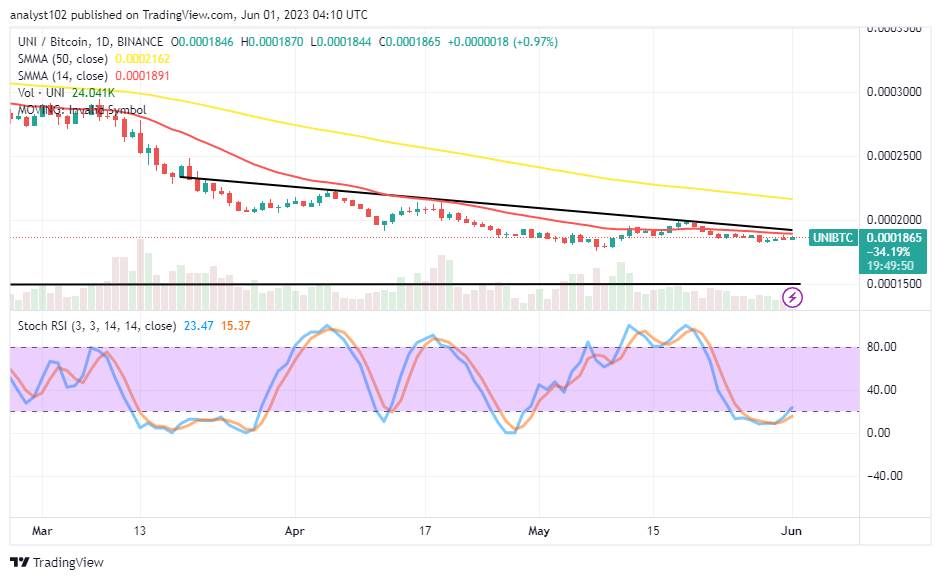
UNI/BTC Price Analysis
In contrast, the Uniswap market follows a bearish move, hitting a resistance point against Bitcoin as lower-range postures are also around the smaller indicator. At the top of the 14-day SMA trend line is the 50-day SMA trend line. The stochastic oscillators have moved northward from 15.37 to 23.47 points, which is the depth of the oversold area. A psychological analysis of the current trade affairs implies that the base cryptocurrency’s price sets to reclaim its competitive worth in the market.
Note: Cryptosignals.org is not a financial advisor. Do your research before investing your funds in any financial asset or presented product or event. We are not responsible for your investing results.
You can purchase Lucky Block here. Buy LBLOCK