Uniswap (UNI/USD) Price Deepens Corrections
Estimated Reading Time: 3 minutes
Don’t invest unless you’re prepared to lose all the money you invest. This is a high-risk investment and you are unlikely to be protected if something goes wrong. Take 2 minutes to learn more
Uniswap Price Prediction – December 16
There has been a continuity process in the UNI/USD market-operation downward forces as the crypto-economic price deepens corrections. The crypto-coin now trades around an estimated valuation of $15 at a relative negative percentage rate of about 1.24.
UNI/USD Market
Key Levels:
Resistance levels: $18, $22, $25
Support levels: $12, $10, $8
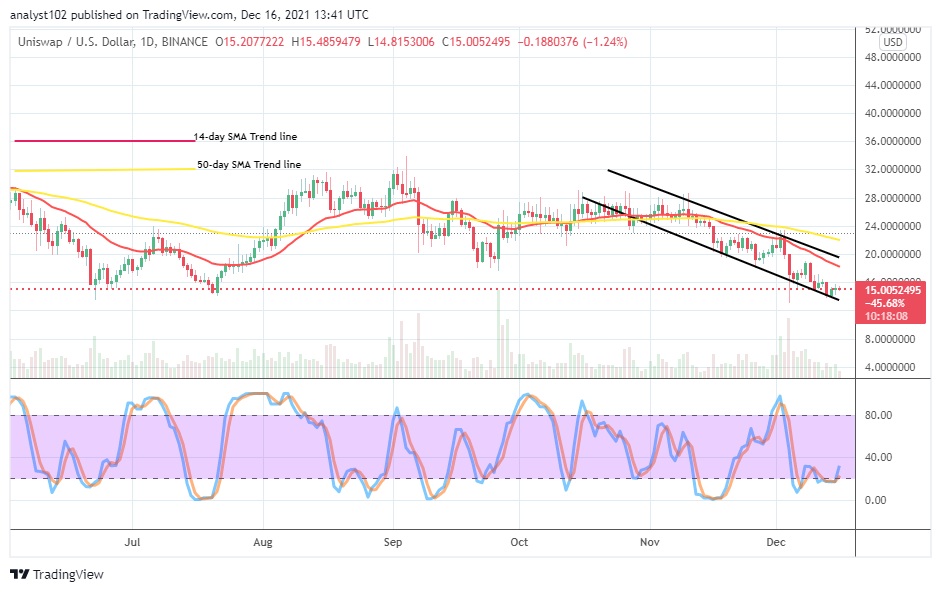
UNI/USD – Daily Chart
The UNI/USD daily chart shows that the crypto-economic price deepens corrections of its valuation as variant candlesticks characterizing smaller forces to the downside close to the path of the lower bearish trend line drawn. The upper bearish trend line drew closer over the smaller SMA indicator. The 50-day SMA trend line is above the 14-day SMA trend line. The Stochastic Oscillators are at the range of 20, with their lines crossed slightly northbound. A tiny candlestick is forming to give a clear picture of the situation portends a minute-active bearish signal to negate getting an upswing quickly as of writing.
Should traders hold on, placing positions as the UNI/USD market price deepens corrections?
The rate that the UNI/USD market operations decline doesn’t give an obvious pattern to ascertain an entry as the crypto-economic price deepens corrections until the present. However, as it is, both long-term traders and investors may continue to consider joining the market as it goes dipping to constitute the habit of buying and holding. And sell later while the price rises back to the moon afterward.
On the downside of the technical analysis, the UNI/USD market short-position takers needed to result in a consolidation moving style around the resistance trading spot at $15. The resistance trading spot at the $18 level may serve as an area of energy-mustering by sellers. But, an aggressive breakout around that value line will invalidate any sell order launched at that time.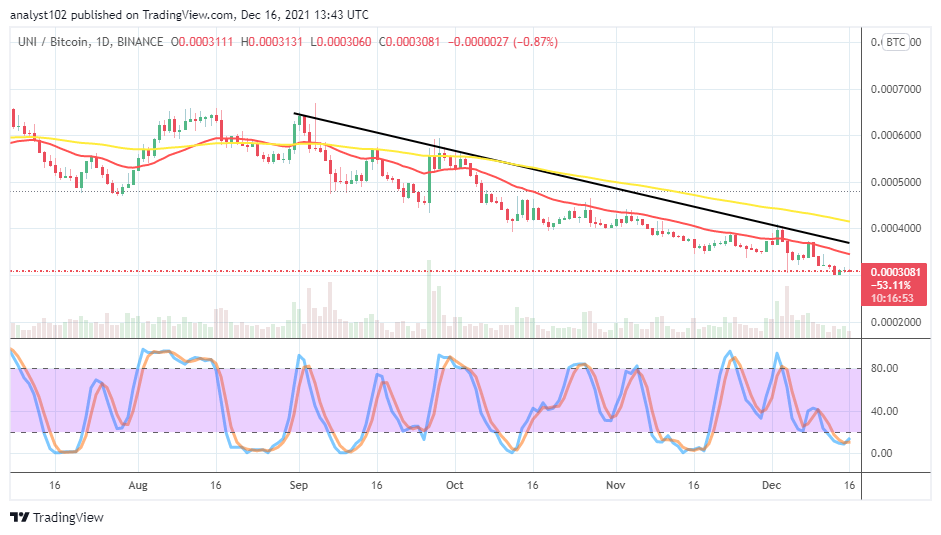
UNI/BTC Price Analysis
In comparison, the trending pace between Uniswap and Bitcoin, as revealed on the daily price analysis chart, shows a continued bearish movement outlook. In other words, it means that the base crypto is lessening in momentums to push against its counter-trading crypto. The 14-day SMA trend line is underneath the 50-day SMA trend line. The Stochastic Oscillators are in the oversold region with the lines jointly crossed northbound slightly. That suggests the possibility that the base-crypto trading instrument has been placed on a high expectation table to regain its stances as paired with the flagship countering crypto in the near time.
Note: Cryptosignals.org is not a financial advisor. Do your research before investing your funds in any financial asset or presented product or event. We are not responsible for your investing results.
You can purchase crypto coins here. Buy Tokens