Uniswap (UNI/USD) Price Has Pushed Lower to Find Support
Estimated Reading Time: 3 minutes
Don’t invest unless you’re prepared to lose all the money you invest. This is a high-risk investment and you are unlikely to be protected if something goes wrong. Take 2 minutes to learn more
Uniswap Price Prediction – June 8
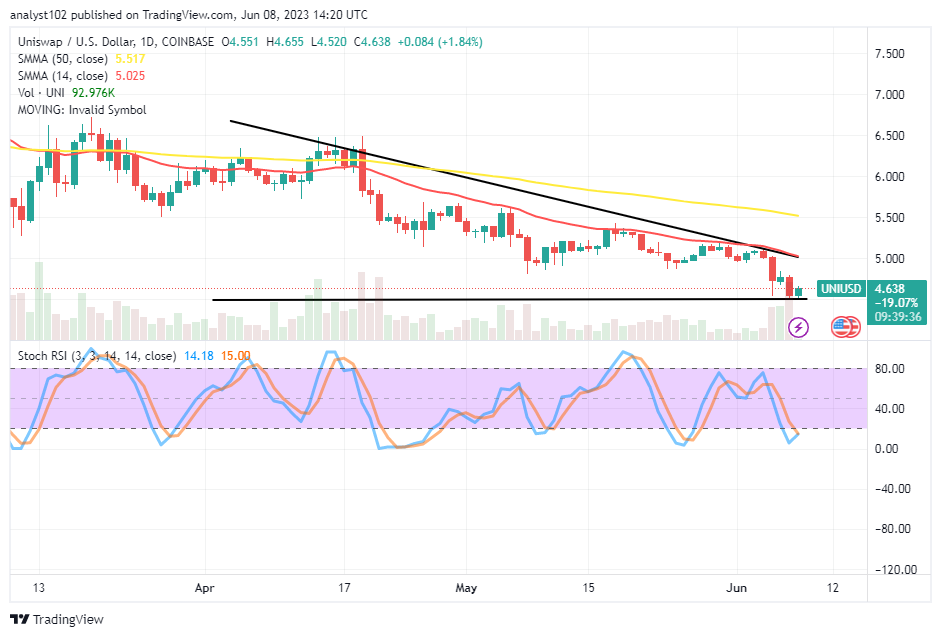
In the last several days back, the business transactions between the Uniswap trade and the US coin have prevailed by bears’ reactions, leading the crypto-economic price to get pushed lower to find support around the point of $4.50. Opinions are now on the horizon of having some rising moments thriving in the subsequent sessions as bulls are driving northward around the $.638 above the last lower-trading point at $4.520 on the positive average percentage rate of 1.84. All those sentiments put together mean investors should come in to add to their long-term running portfolios before further increases continue to flourish in the crypto economy business activities.
UNI/USD Market
Key Levels:
Resistance levels: $5.50, $6, $6.50
Support levels: $4.50, $4, $3.50
UNI/USD – Daily Chart
indicatThe UNI/USD daily chart reveals the crypto-economic has pushed lower to find support around the horizontal line drawn at the $4.50 level. A descending triangular pattern in this market has now fully depicted as the bearish trend line drawn at the top to back the smaller Simple Moving Average. The 50-day SMA trend line is at $5.517 above the $5.025 value line of the 50-day SMA trend line. The Stochastic Oscillators have dipped northbound into the oversold region. And they are now trying to swing back northbound, seemingly trying to place at 14.18 to 15.00.
Can the UNI/USD trade have more dropping sessions around or below $4.50 soon?
At this time, the dipping moments in the UNI/USD market operations have featured over a long-term, gently and systemically moving in a downward trend to reach a logical end around the the$4.50, as that believes to have gotten pushed lower to find support. It would therefore be a more difficult task to maintain a position for a long time beyond the value line when witnessing a new shorting order. Our verdict currently is that investors and buyers should launch back into the former trading instrument against its latter.
On the downward-shifting positions of the technical analysis, it appears now that sellers must put their activities on hold until another formation of price convergences occur at a higher-trading resistance is achieved. Resistances around $5 or between it and a higher of $5.50 have been projected as the optimum spots before that assumption comes to pass. 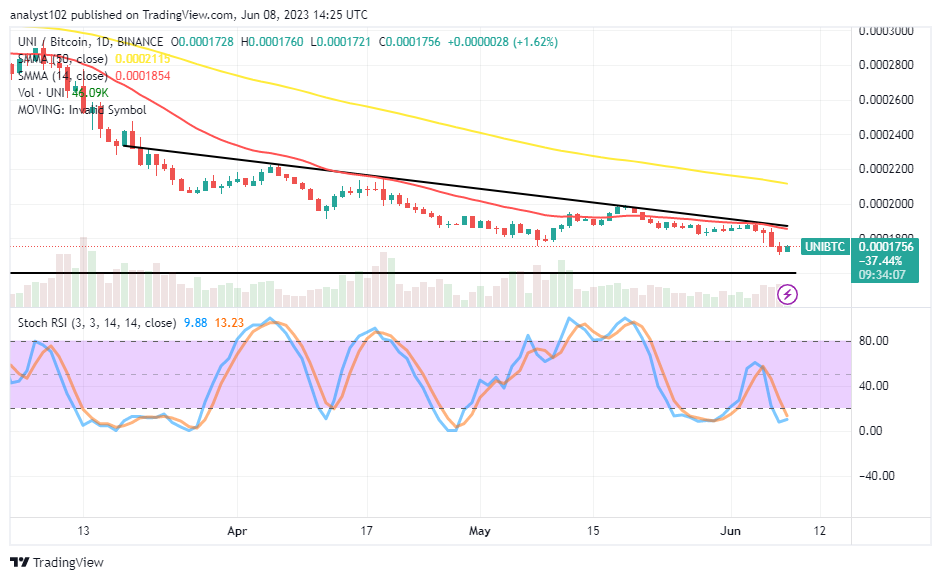
UNI/BTC Price Analysis
In contrast, the Uniswap trade has considerably pushed lower to find support against the purchasing power of Bitcoin below the SMA trend lines. The bearish trend line has drawn around the 14-day SMA indicator underneath the 50-day SMA indicator. The final bearish candlestick that appeared yesterday’s lower horizontal line moved a little bit away to the downside. The Stochastic Oscillators are oversold and appear to swing back and forth between 9.88 and 13.23 levels, indicating that a rise in the base cryptocurrency relative to its counter-trading instrument is about to occur.
Note: Cryptosignals.org is not a financial advisor. Do your research before investing your funds in any financial asset or presented product or event. We are not responsible for your investing results.
You can purchase Lucky Block here. Buy LBLOCK