Uniswap (UNI/USD) Price Intensifies Effort, Moving in a Rallying Mode
Estimated Reading Time: 3 minutes
Don’t invest unless you’re prepared to lose all the money you invest. This is a high-risk investment and you are unlikely to be protected if something goes wrong. Take 2 minutes to learn more

Free Crypto Signals Channel
UniswapPrice Prediction – March 31
The slow-and-steady pushing away of the UNI/USD market has not yet been over as the crypto-economic price intensifies effort, moving in a rallying mode to hit the $12 line. The crypto economy is currently trading around $11 at a minute positive percentage of 0.76.
UNI/USD Market
Key Levels:
Resistance levels: $16, $20, $24
Support levels: $12, $10, $8
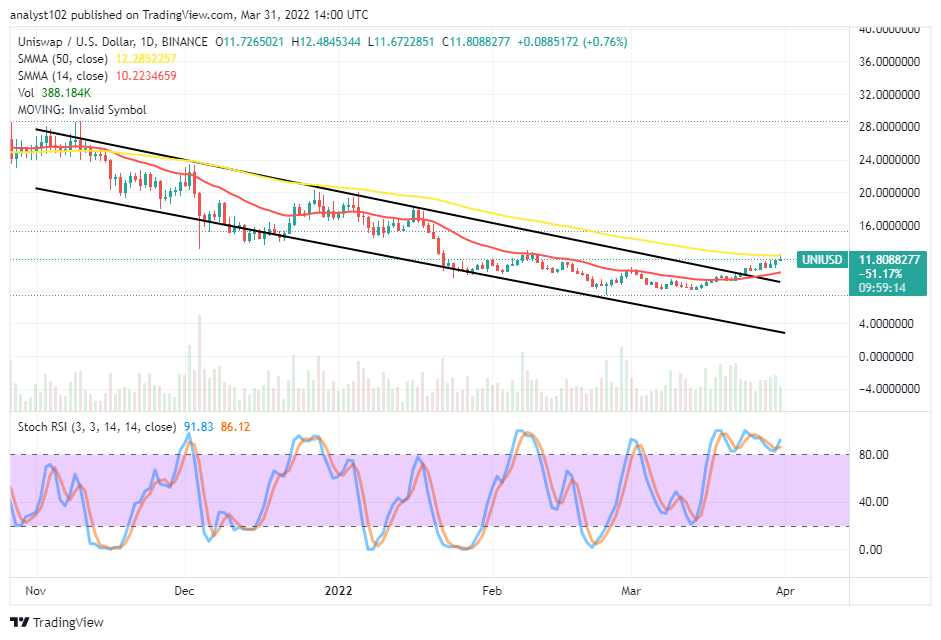
UNI/USD – Daily Chart
The UNI/USD daily chart showcases the crypto-economic market price intensifies effort, moving in a rallying mode. The 50-day SMA indicator is above the 14-day SMA indicator. The upper bearish trend line drew southward briefly past the smaller SMA. The Stochastic Oscillators are in the overbought region, moving in a consolidation manner to signify that an upward force is in progress.
Can there be a sudden breakout at the 50-day SMA indicator as the crypto-economic price intensifies effort, moving in a allying mode?
A sudden breakout against the 50-day SMA indicator may not hold for long as the crypto-economic price intensifies effort, moving in a rallying mode. It has been a difficult trading situation to detect easy patterns for buying entries. Long-position placers may need to suspend the execution of new orders to avoid getting whipsawed in no time.
On the downside of the technical analysis, the UNI/USD market short-position placers have yet not had a brighter sign to suggest the possibility of having a downward trend returning. The market has obtained the highest point of exhaustion in its current rallying process. Therefore, a free-fall is to happen in no time. Resistance points beneath $16 or around $12 can be instrumental in determining the following price actions.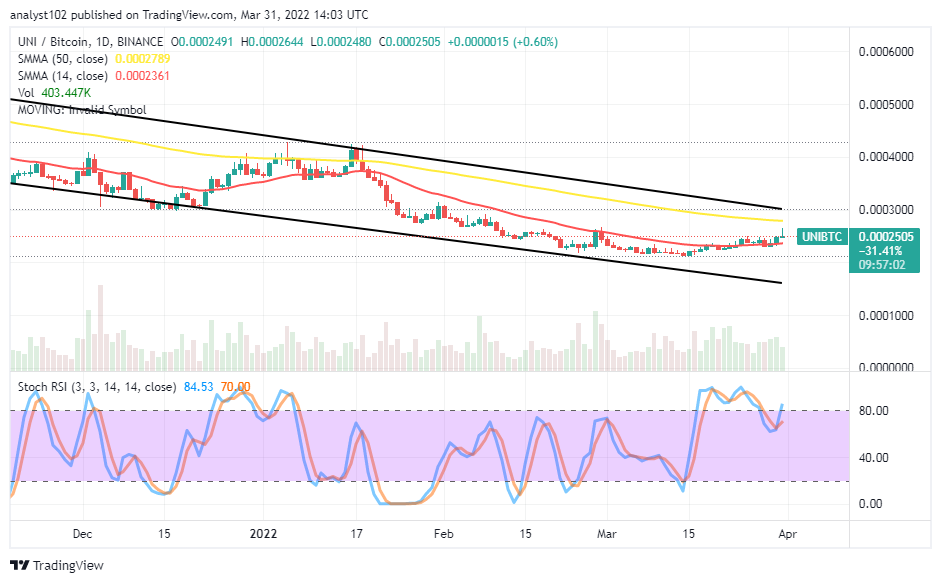
UNI/BTC Price Analysis
In comparison, Uniswap appears tempting to push against Bitcoin showcased by the Stochastic Oscillators. The cryptocurrency pair price intensifies effort to move more ups, a bit away, from the 14-day SMA trend line. The 50-day SMA indicator is above the 14-day SMA indicator. The Stochastic Oscillators have crossed northbound from a lower range line slightly against the range of 80. That signifies the base crypto is on a gradual-moving process against the trending capacity of the counter crypto.
Note: Cryptosignals.org is not a financial advisor. Do your research before investing your funds in any financial asset or presented product or event. We are not responsible for your investing results.
You can purchase Lucky Block here. Buy LBlock: